## Horizontal Bar Charts: Share of Plastic Waste Management by Region (2019)
### Overview
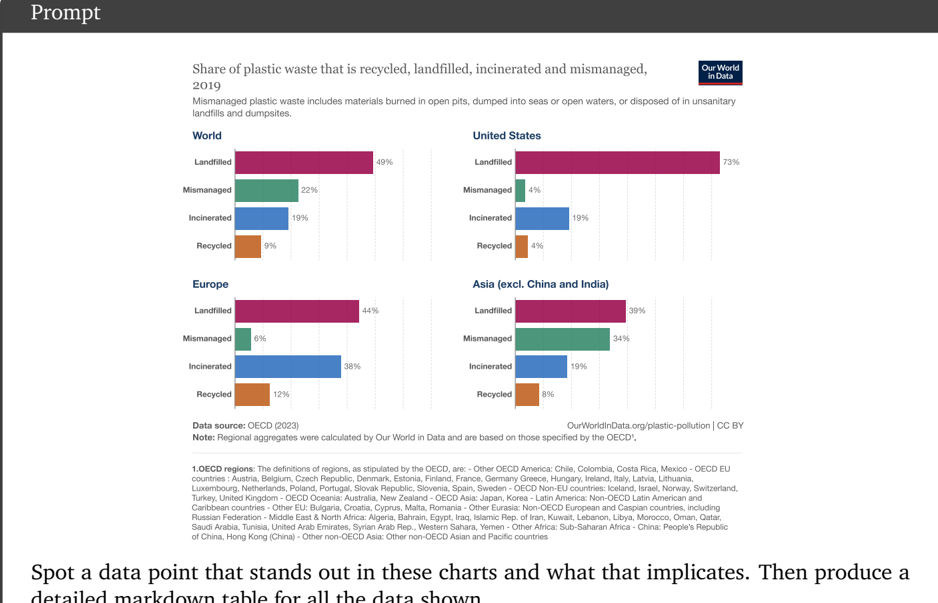
The image displays a set of four horizontal bar charts from "Our World in Data," illustrating the percentage distribution of plastic waste management methods for the year 2019. The data is broken down by four geographic aggregates: World, United States, Europe, and Asia (excluding China and India). The charts compare four disposal methods: Landfilled, Mismanaged, Incinerated, and Recycled.
### Components/Axes
* **Chart Title:** "Share of plastic waste that is recycled, landfilled, incinerated and mismanaged, 2019"
* **Subtitle/Definition:** "Mismanaged plastic waste includes materials burned in open pits, dumped into seas or open waters, or disposed of in unsanitary landfills and dumpsites."
* **Data Source:** "OECD (2023)" with a note that regional aggregates were calculated by Our World in Data.
* **License:** "OurWorldInData.org/plastic-pollution | CC BY"
* **Regions (Chart Titles):** World, United States, Europe, Asia (excl. China and India).
* **Categories (Y-axis Labels):** Landfilled, Mismanaged, Incinerated, Recycled.
* **Legend/Color Code:**
* **Landfilled:** Magenta/Dark Pink
* **Mismanaged:** Green
* **Incinerated:** Blue
* **Recycled:** Orange
* **Scale (X-axis):** Implicit percentage scale from 0% to approximately 80% (based on the longest bar). Exact axis markers are not shown, but values are labeled at the end of each bar.
* **Footnote:** A detailed footnote defines the specific countries included in each OECD regional aggregate (e.g., "Other OECD America: Chile, Colombia, Costa Rica, Mexico...").
### Detailed Analysis
The following table reconstructs the data presented in the four charts. All values are approximate percentages as labeled on the bars.
| Region | Landfilled | Mismanaged | Incinerated | Recycled |
| :--- | :--- | :--- | :--- | :--- |
| **World** | 49% | 22% | 19% | 9% |
| **United States** | 73% | 4% | 19% | 4% |
| **Europe** | 44% | 6% | 38% | 12% |
| **Asia (excl. China and India)** | 39% | 34% | 19% | 8% |
**Trend Verification per Region:**
* **World:** Landfilling is the dominant method (49%), followed by mismanagement (22%). Recycling is the least common method (9%).
* **United States:** Landfilling is overwhelmingly dominant (73%), far exceeding any other region. Mismanagement and recycling are very low (4% each).
* **Europe:** Landfilling (44%) and incineration (38%) are the primary methods, with incineration being significantly higher here than in other regions. Recycling is the highest among the shown regions (12%).
* **Asia (excl. China and India):** Landfilling (39%) and mismanagement (34%) are the two largest categories, with mismanagement being exceptionally high compared to other regions. Incineration and recycling are lower and equal (19% and 8%, respectively).
### Key Observations
1. **Major Outlier - United States Landfilling:** The most striking data point is the **73% landfilling rate for the United States**. This is 24 percentage points higher than the next highest region (World at 49%) and nearly double the rate of Europe (44%). It indicates an extreme reliance on landfill disposal for plastic waste.
2. **Regional Disparity in Mismanagement:** There is a vast difference in mismanaged plastic waste. Asia (excl. China and India) has a rate of **34%**, which is over 5 times higher than Europe (6%) and 8.5 times higher than the United States (4%).
3. **Europe's Incineration Focus:** Europe has a notably high incineration rate of **38%**, which is double that of any other region shown (all others at 19%). This suggests a strong regional policy or infrastructure preference for waste-to-energy over landfilling.
4. **Low Global Recycling Rate:** Despite being a highlighted solution, the global recycling rate for plastic waste is only **9%**. Even the highest regional rate (Europe at 12%) is modest.
### Interpretation
The data reveals fundamentally different regional strategies and challenges in managing plastic waste, with significant environmental implications.
* **The United States' 73% landfilling rate** suggests a system heavily dependent on available land for disposal, potentially indicating underinvestment in alternative waste processing infrastructure (like advanced recycling or incineration) or economic/policy factors that make landfilling the cheapest option. This approach consumes land and poses long-term leakage risks.
* **The high mismanagement rate in Asia (excl. China and India) at 34%** points to systemic challenges in waste collection, containment, and processing infrastructure. This directly correlates with plastic pollution entering terrestrial and aquatic ecosystems in the region, highlighting an urgent need for infrastructure development and governance.
* **Europe's profile (44% landfill, 38% incineration)** reflects a more diversified, albeit still disposal-heavy, approach. The high incineration rate reduces landfill use but raises questions about emissions and the circular economy, as it destroys the material rather than recovering it.
* **The consistently low recycling rates (4-12%) across all regions** underscore the global difficulty in establishing effective, scalable, and economically viable plastic recycling systems. It indicates that current "recycling" efforts are a minor part of the waste stream management, with the vast majority of plastic waste being disposed of via landfill, incineration, or mismanagement.
**In summary, the charts depict a global plastic waste management system dominated by disposal (landfill and incineration) and, in some regions, significant mismanagement. The stark regional differences highlight how local infrastructure, policy, and economic conditions shape waste outcomes, with the U.S. relying heavily on landfills and parts of Asia struggling with mismanagement. The low recycling figures everywhere suggest that upstream solutions (reduction, redesign) and major investments in circular infrastructure are critical to addressing the plastic waste crisis.**