## Bar Chart: Share of Plastic Waste
### Overview
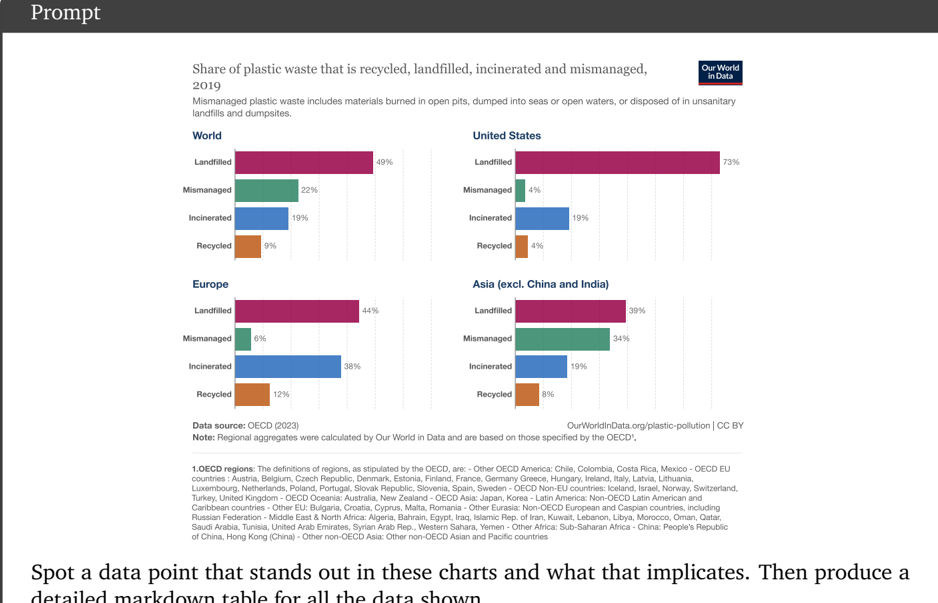
The bar chart illustrates the share of plastic waste that is recycled, landfilled, incinerated, and mismanaged across different regions in 2019. The chart is divided into four sections, each representing a different region: the World, Europe, Asia (excluding China and India), and the United States.
### Components/Axes
- **X-axis**: Represents the different types of waste management: Landfilled, Mismanaged, Incinerated, Recycled.
- **Y-axis**: Represents the regions: World, Europe, Asia (excluding China and India), United States.
- **Legend**: Located at the bottom right corner, indicating the color coding for each waste management type.
- **Data Points**: Each bar represents the percentage of plastic waste in a specific region for a particular waste management type.
### Detailed Analysis or ### Content Details
- **World**:
- Landfilled: 49%
- Mismanaged: 22%
- Incinerated: 19%
- Recycled: 9%
- **Europe**:
- Landfilled: 44%
- Mismanaged: 8%
- Incinerated: 38%
- Recycled: 12%
- **Asia (excluding China and India)**:
- Landfilled: 39%
- Mismanaged: 34%
- Incinerated: 19%
- Recycled: 8%
- **United States**:
- Landfilled: 73%
- Mismanaged: 4%
- Incinerated: 19%
- Recycled: 4%
### Key Observations
- The United States has the highest percentage of landfilled plastic waste (73%), followed by Europe (44%).
- Asia (excluding China and India) has the highest percentage of mismanaged plastic waste (34%).
- Europe has the highest percentage of recycled plastic waste (12%).
### Interpretation
The data suggests that there is a significant variation in how plastic waste is managed across different regions. The United States has a high rate of landfilling, which could be due to a lack of recycling infrastructure or policies. Europe has a high rate of recycling, which could be due to effective recycling policies and infrastructure. Asia (excluding China and India) has a high rate of mismanagement, which could be due to a lack of awareness or enforcement of waste management policies. The data highlights the need for improved waste management policies and infrastructure in all regions to reduce plastic waste and its environmental impact.