## Bar Chart: Share of Plastic Waste Management by Region (2019)
### Overview
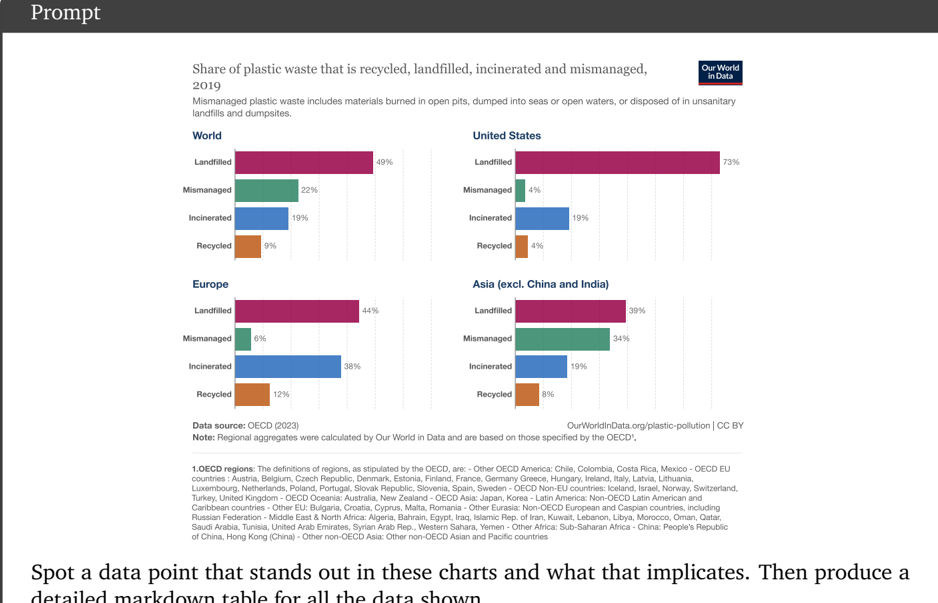
The chart visualizes the distribution of plastic waste management across four regions: **World**, **United States**, **Europe**, and **Asia (excluding China and India)**. Categories include **Landfilled**, **Mismanaged**, **Incinerated**, and **Recycled** plastic waste. Data is aggregated from OECD regions and presented as percentages.
---
### Components/Axes
- **X-Axis**: Categories of waste management (Landfilled, Mismanaged, Incinerated, Recycled).
- **Y-Axis**: Regions (World, United States, Europe, Asia excl. China/India).
- **Legend**:
- **Purple**: Landfilled
- **Green**: Mismanaged
- **Blue**: Incinerated
- **Orange**: Recycled
- **Data Source**: OECD (2023), calculated by Our World in Data.
---
### Detailed Analysis
#### World
- **Landfilled**: 49% (Purple)
- **Mismanaged**: 22% (Green)
- **Incinerated**: 19% (Blue)
- **Recycled**: 9% (Orange)
#### United States
- **Landfilled**: 73% (Purple)
- **Mismanaged**: 4% (Green)
- **Incinerated**: 19% (Blue)
- **Recycled**: 4% (Orange)
#### Europe
- **Landfilled**: 44% (Purple)
- **Mismanaged**: 6% (Green)
- **Incinerated**: 38% (Blue)
- **Recycled**: 12% (Orange)
#### Asia (excl. China/India)
- **Landfilled**: 39% (Purple)
- **Mismanaged**: 34% (Green)
- **Incinerated**: 19% (Blue)
- **Recycled**: 8% (Orange)
---
### Key Observations
1. **Landfilling Dominance**: The U.S. has the highest landfill usage (73%), while Europe has the lowest (44%).
2. **Mismanagement Crisis**: Asia (excl. China/India) has the highest mismanaged waste (34%), far exceeding the global average (22%).
3. **Incineration Trends**: Europe leads in incineration (38%), suggesting advanced waste-to-energy infrastructure.
4. **Recycling Deficits**: Recycling rates are lowest in the U.S. (4%) and Asia (8%), with the global average at 9%.
---
### Interpretation
- **Regional Disparities**: The U.S. prioritizes landfilling, possibly due to historical infrastructure investments and lax regulations. Europe’s high incineration rate reflects robust waste-to-energy policies. Asia’s mismanagement highlights systemic gaps in waste collection and processing.
- **Global Recycling Gap**: The low global recycling rate (9%) underscores a critical need for circular economy policies and infrastructure investment.
- **Mismanagement Implications**: Asia’s high mismanagement (34%) correlates with open dumping and ocean pollution, posing severe environmental risks.
---
### Data Source Notes
- **OECD Regions**: Definitions include specific country groupings (e.g., OECD EU, OECD Asia). Non-OECD regions (e.g., China, Pacific nations) are excluded from regional aggregates.
- **Mismanaged Definition**: Includes open burning, ocean dumping, and unsanitary landfills.
---
### Critical Data Point
- **Asia’s Mismanaged Waste (34%)**: This outlier suggests inadequate waste infrastructure and regulatory enforcement, contributing disproportionately to global plastic pollution.