## Network Diagram: Interaction Graph
### Overview
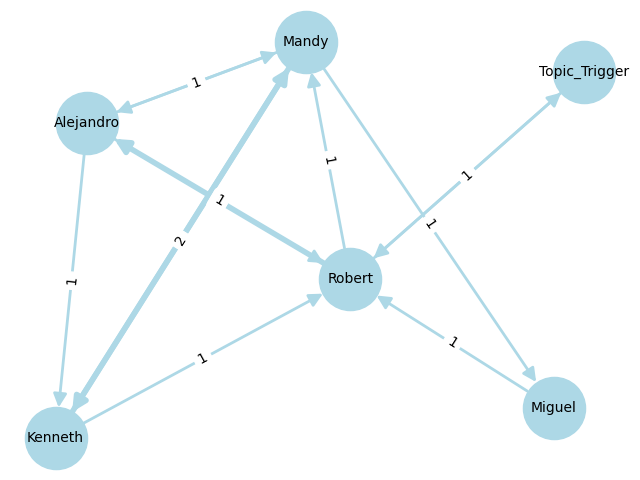
The image is a network diagram illustrating interactions between several entities, represented as light blue circles. The entities are labeled with names: Alejandro, Mandy, Kenneth, Robert, Miguel, and Topic_Trigger. The connections between these entities are represented by light blue arrows, with numerical labels indicating the strength or frequency of the interaction.
### Components/Axes
* **Nodes:** The light blue circles represent entities. The entities are:
* Alejandro (top-left)
* Mandy (top-center)
* Kenneth (bottom-left)
* Robert (center)
* Miguel (bottom-right)
* Topic\_Trigger (top-right)
* **Edges:** The light blue arrows represent interactions between entities. The arrows are labeled with numerical values (1 or 2) indicating the interaction strength.
### Detailed Analysis or Content Details
* **Alejandro:**
* Sends an interaction of strength 1 to Kenneth.
* Sends an interaction of strength 1 to Mandy.
* Receives an interaction of strength 2 from Kenneth.
* **Mandy:**
* Sends an interaction of strength 1 to Robert.
* Receives an interaction of strength 1 from Alejandro.
* Receives an interaction of strength 1 from Robert.
* **Kenneth:**
* Sends an interaction of strength 2 to Alejandro.
* Sends an interaction of strength 1 to Robert.
* **Robert:**
* Sends an interaction of strength 1 to Mandy.
* Sends an interaction of strength 1 to Miguel.
* Receives an interaction of strength 1 from Mandy.
* Receives an interaction of strength 1 from Kenneth.
* Receives an interaction of strength 1 from Topic\_Trigger.
* **Miguel:**
* Receives an interaction of strength 1 from Robert.
* **Topic\_Trigger:**
* Sends an interaction of strength 1 to Robert.
### Key Observations
* Robert is the central node, receiving interactions from multiple entities (Mandy, Kenneth, Topic\_Trigger) and sending interactions to Mandy and Miguel.
* The interaction between Kenneth and Alejandro is bidirectional, with Kenneth sending a stronger interaction (strength 2) to Alejandro.
* Topic\_Trigger only interacts with Robert.
* Miguel only receives an interaction from Robert.
### Interpretation
The network diagram visualizes the relationships and interactions between different entities. Robert appears to be a central figure in this network, acting as a hub for information or influence. The varying strengths of interactions suggest different levels of engagement or communication frequency between the entities. The diagram could represent a social network, a communication network, or any system where entities interact with each other. The directionality of the arrows indicates the flow of information or influence. The fact that Topic\_Trigger only interacts with Robert suggests that it might be a specialized source of information or a trigger event that primarily affects Robert.