\n
## Diagram: Relationship Network
### Overview
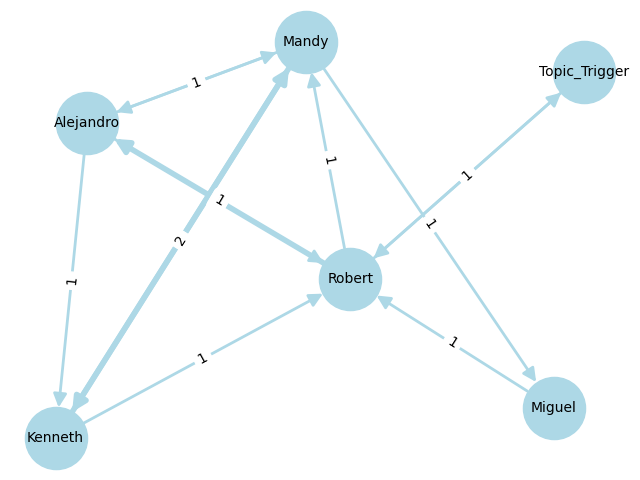
The image depicts a directed graph representing relationships between individuals and a "Topic_Trigger". Nodes represent people (Alejandro, Mandy, Robert, Kenneth, Miguel) and a topic trigger. Edges (arrows) indicate a relationship, with numerical labels indicating the strength or frequency of that relationship.
### Components/Axes
The diagram consists of:
* **Nodes:** Alejandro, Mandy, Robert, Kenneth, Miguel, Topic_Trigger. Each node is represented by a light blue circle with the name inside.
* **Edges:** Directed arrows connecting the nodes. Each arrow has a numerical label indicating the relationship strength.
* **No explicit axes or legend.** The relationships are visually represented by the arrows and their associated numerical values.
### Detailed Analysis or Content Details
The following relationships are depicted:
* **Mandy** to **Alejandro**: Relationship strength = 1
* **Mandy** to **Robert**: Relationship strength = 1
* **Mandy** to **Topic_Trigger**: Relationship strength = 1
* **Alejandro** to **Kenneth**: Relationship strength = 1
* **Alejandro** to **Robert**: Relationship strength = 2
* **Robert** to **Kenneth**: Relationship strength = 1
* **Robert** to **Miguel**: Relationship strength = 1
* **Robert** to **Topic_Trigger**: Relationship strength = 1
* **Topic_Trigger** to **Miguel**: Relationship strength = 1
The nodes are positioned as follows:
* **Mandy**: Top-center
* **Alejandro**: Top-left
* **Robert**: Center
* **Kenneth**: Bottom-left
* **Miguel**: Bottom-right
* **Topic_Trigger**: Top-right
### Key Observations
* **Mandy** appears to be a central node, initiating relationships with Alejandro, Robert, and the Topic_Trigger.
* **Robert** is also a central node, receiving connections from Mandy and Alejandro, and initiating connections to Kenneth, Miguel, and the Topic_Trigger.
* **Kenneth** and **Miguel** are peripheral nodes, receiving connections but not initiating any.
* The relationship between Alejandro and Robert has a strength of 2, which is the highest value in the diagram, suggesting a stronger connection than other relationships.
* The Topic_Trigger is connected to Mandy and Robert, and it in turn connects to Miguel.
### Interpretation
This diagram likely represents a network of influence or communication. The numerical values on the edges could represent the frequency of interaction, the strength of a connection, or the amount of information exchanged.
* **Mandy** and **Robert** act as key influencers or intermediaries, connecting different parts of the network.
* The connection between **Alejandro** and **Robert** being the strongest suggests a particularly close or frequent relationship.
* The **Topic_Trigger** seems to be a catalyst that connects to Mandy and Robert, and ultimately influences Miguel. This could represent a specific event or idea that is being disseminated through the network.
* **Kenneth** and **Miguel** are more passive recipients of information or influence, relying on others to initiate contact.
The diagram suggests a hierarchical structure with Mandy and Robert at the top, Alejandro as a secondary influencer, and Kenneth and Miguel as more peripheral members. The Topic_Trigger acts as a point of initiation or propagation within the network. Without further context, it's difficult to determine the exact nature of these relationships, but the diagram provides a clear visual representation of the network's structure and key connections.