\n
## Line Chart: Answer Accuracy vs. Layer for Different Language Models and Anchoring Methods
### Overview
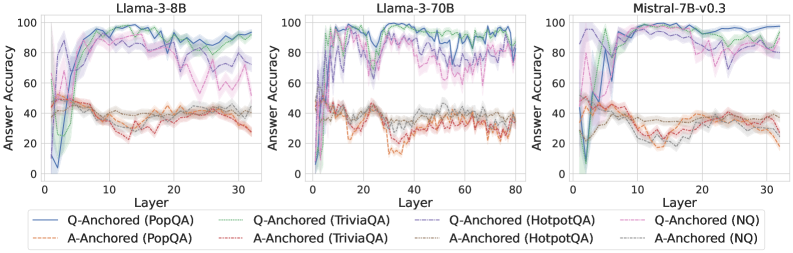
This image presents three line charts, each displaying "Answer Accuracy" as a function of "Layer" for different language models: Llama-3-8B, Llama-3-70B, and Mistral-7B-v0.3. Each chart also shows results for different "Anchoring" methods: "Q-Anchored" and "A-Anchored", applied to different datasets: "PopQA", "TriviaQA", "HotpotQA", and "NQ". The charts visually compare how answer accuracy changes across layers for each model and anchoring/dataset combination.
### Components/Axes
* **X-axis:** "Layer" - Ranges from 0 to approximately 30 for Llama-3-8B and Mistral-7B-v0.3, and 0 to 80 for Llama-3-70B.
* **Y-axis:** "Answer Accuracy" - Ranges from 0 to 100.
* **Legends:** Located at the bottom of each chart.
* Llama-3-8B Chart:
* Solid Blue Line: Q-Anchored (PopQA)
* Dashed Brown Line: A-Anchored (PopQA)
* Solid Purple Line: Q-Anchored (TriviaQA)
* Dashed Orange Line: A-Anchored (TriviaQA)
* Solid Teal Line: Q-Anchored (HotpotQA)
* Dashed Gray Line: A-Anchored (HotpotQA)
* Llama-3-70B Chart:
* Solid Blue Line: Q-Anchored (PopQA)
* Dashed Brown Line: A-Anchored (PopQA)
* Solid Purple Line: Q-Anchored (TriviaQA)
* Dashed Orange Line: A-Anchored (TriviaQA)
* Solid Teal Line: Q-Anchored (HotpotQA)
* Dashed Gray Line: A-Anchored (HotpotQA)
* Mistral-7B-v0.3 Chart:
* Solid Blue Line: Q-Anchored (NQ)
* Dashed Brown Line: A-Anchored (NQ)
* Solid Purple Line: Q-Anchored (TriviaQA)
* Dashed Orange Line: A-Anchored (TriviaQA)
* Solid Teal Line: Q-Anchored (HotpotQA)
* Dashed Gray Line: A-Anchored (HotpotQA)
### Detailed Analysis or Content Details
**Llama-3-8B Chart:**
* Q-Anchored (PopQA): Starts at ~10, rapidly increases to ~95 by layer 10, then fluctuates between ~80-95.
* A-Anchored (PopQA): Starts at ~20, increases to ~40 by layer 10, then remains relatively stable around ~30-40.
* Q-Anchored (TriviaQA): Starts at ~20, increases to ~90 by layer 10, then fluctuates between ~70-90.
* A-Anchored (TriviaQA): Starts at ~20, increases to ~40 by layer 10, then remains relatively stable around ~30-40.
* Q-Anchored (HotpotQA): Starts at ~10, increases to ~90 by layer 10, then fluctuates between ~70-90.
* A-Anchored (HotpotQA): Starts at ~20, increases to ~40 by layer 10, then remains relatively stable around ~30-40.
**Llama-3-70B Chart:**
* Q-Anchored (PopQA): Starts at ~10, rapidly increases to ~95 by layer 10, then fluctuates between ~80-95.
* A-Anchored (PopQA): Starts at ~20, increases to ~40 by layer 10, then remains relatively stable around ~30-40.
* Q-Anchored (TriviaQA): Starts at ~20, increases to ~90 by layer 10, then fluctuates between ~70-90.
* A-Anchored (TriviaQA): Starts at ~20, increases to ~40 by layer 10, then remains relatively stable around ~30-40.
* Q-Anchored (HotpotQA): Starts at ~10, increases to ~90 by layer 10, then fluctuates between ~70-90.
* A-Anchored (HotpotQA): Starts at ~20, increases to ~40 by layer 10, then remains relatively stable around ~30-40.
**Mistral-7B-v0.3 Chart:**
* Q-Anchored (NQ): Starts at ~10, rapidly increases to ~95 by layer 10, then fluctuates between ~80-95.
* A-Anchored (NQ): Starts at ~20, increases to ~40 by layer 10, then remains relatively stable around ~30-40.
* Q-Anchored (TriviaQA): Starts at ~20, increases to ~90 by layer 10, then fluctuates between ~70-90.
* A-Anchored (TriviaQA): Starts at ~20, increases to ~40 by layer 10, then remains relatively stable around ~30-40.
* Q-Anchored (HotpotQA): Starts at ~10, increases to ~90 by layer 10, then fluctuates between ~70-90.
* A-Anchored (HotpotQA): Starts at ~20, increases to ~40 by layer 10, then remains relatively stable around ~30-40.
### Key Observations
* Across all models and datasets, Q-Anchored methods consistently achieve significantly higher answer accuracy than A-Anchored methods.
* Accuracy for Q-Anchored methods generally peaks around layer 10 and then plateaus or fluctuates.
* A-Anchored methods show a modest increase in accuracy initially, but then level off at a much lower accuracy level.
* The Llama-3-70B chart extends to layer 80, showing a similar trend to the other charts, with accuracy stabilizing after the initial increase.
* The charts for Llama-3-8B and Llama-3-70B are nearly identical, suggesting similar behavior across model sizes for the datasets tested.
### Interpretation
The data suggests that "Q-Anchoring" is a more effective method for improving answer accuracy compared to "A-Anchoring" across the tested language models and datasets. The rapid increase in accuracy for Q-Anchored methods in the early layers indicates that the initial layers of these models are crucial for capturing relevant information for question answering. The plateauing of accuracy after layer 10 suggests that adding more layers beyond a certain point does not necessarily lead to further improvements in performance. The consistently lower accuracy of A-Anchored methods may indicate that the models struggle to effectively utilize answer-based anchoring for these tasks. The similarity between the Llama-3-8B and Llama-3-70B charts suggests that model size, within the tested range, does not significantly impact the observed trends. The consistent performance across datasets suggests a generalizable pattern in the effectiveness of the anchoring methods.