\n
## Line Charts: Answer Accuracy Across Layers for Three Language Models
### Overview
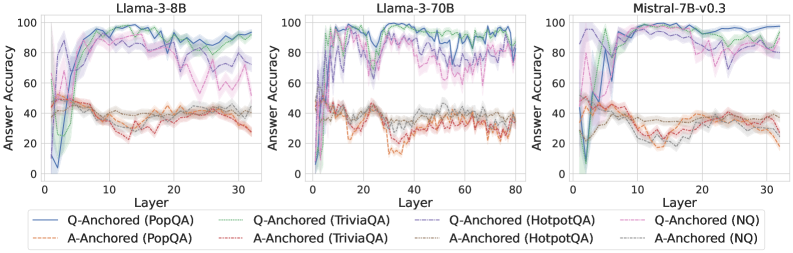
The image displays three horizontally arranged line charts, each plotting "Answer Accuracy" (y-axis) against "Layer" (x-axis) for a specific large language model. The charts compare the performance of two anchoring methods ("Q-Anchored" and "A-Anchored") across four question-answering datasets (PopQA, TriviaQA, HotpotQA, NQ). The overall visual suggests an analysis of how model performance on different knowledge-intensive tasks evolves through the layers of the neural network.
### Components/Axes
* **Chart Titles (Top Center of each plot):**
* Left Chart: `Llama-3-8B`
* Middle Chart: `Llama-3-70B`
* Right Chart: `Mistral-7B-v0.3`
* **Y-Axis (Left side of each plot):**
* Label: `Answer Accuracy`
* Scale: 0 to 100, with major ticks at 0, 20, 40, 60, 80, 100.
* **X-Axis (Bottom of each plot):**
* Label: `Layer`
* Scale:
* Llama-3-8B: 0 to 30 (ticks every 10).
* Llama-3-70B: 0 to 80 (ticks every 20).
* Mistral-7B-v0.3: 0 to 30 (ticks every 10).
* **Legend (Bottom Center, spanning all charts):**
* **Q-Anchored Series (Solid Lines):**
* Blue solid line: `Q-Anchored (PopQA)`
* Green solid line: `Q-Anchored (TriviaQA)`
* Gray solid line: `Q-Anchored (HotpotQA)`
* Purple solid line: `Q-Anchored (NQ)`
* **A-Anchored Series (Dashed Lines):**
* Orange dashed line: `A-Anchored (PopQA)`
* Red dashed line: `A-Anchored (TriviaQA)`
* Brown dashed line: `A-Anchored (HotpotQA)`
* Pink dashed line: `A-Anchored (NQ)`
### Detailed Analysis
**General Trend Verification:**
* **Q-Anchored Lines (Solid):** For all three models, these lines typically start at very low accuracy (near 0-20%) in the earliest layers, rise sharply to a peak in the middle layers, and then often show a decline or increased volatility in the later layers.
* **A-Anchored Lines (Dashed):** These lines generally start at a moderate accuracy level (around 40-50%), exhibit less dramatic swings than the Q-Anchored lines, and often trend slightly downward or remain relatively flat across layers.
**Model-Specific Data Points (Approximate Values):**
1. **Llama-3-8B:**
* **Q-Anchored (PopQA - Blue):** Starts near 0%, peaks at ~95% around layer 15, declines to ~80% by layer 30.
* **Q-Anchored (TriviaQA - Green):** Follows a similar but slightly lower trajectory than PopQA, peaking near 90%.
* **Q-Anchored (NQ - Purple):** Shows high volatility, with multiple peaks and troughs between 60-95% after layer 10.
* **A-Anchored Series:** All cluster between 30-50% accuracy, showing a slight downward trend. PopQA (Orange) and TriviaQA (Red) are the lowest, often below 40%.
2. **Llama-3-70B:**
* **Q-Anchored Series:** All four datasets show a rapid rise to high accuracy (>80%) by layer 10-20. PopQA (Blue) and TriviaQA (Green) maintain very high accuracy (~90-98%) with less decline in later layers compared to the 8B model. NQ (Purple) and HotpotQA (Gray) are more volatile.
* **A-Anchored Series:** Again cluster in the 30-50% range, with a clearer downward trend for PopQA (Orange) and TriviaQA (Red), dropping to near 20% by layer 80.
3. **Mistral-7B-v0.3:**
* **Q-Anchored Series:** Similar rapid initial rise. PopQA (Blue) and TriviaQA (Green) reach near-perfect accuracy (~95-100%) and sustain it. NQ (Purple) and HotpotQA (Gray) are lower and more volatile, ranging between 60-90%.
* **A-Anchored Series:** Follow the established pattern, hovering between 20-40% with a slight downward slope.
### Key Observations
1. **Consistent Performance Gap:** Across all models and layers, the Q-Anchored method (solid lines) dramatically outperforms the A-Anchored method (dashed lines) on all four QA datasets.
2. **Layer-wise Evolution:** Q-Anchored performance is not static; it shows a characteristic "rise-peak-decline" pattern, suggesting different layers specialize in different aspects of the task. The peak performance layer varies by model and dataset.
3. **Dataset Difficulty:** HotpotQA (Gray lines) and NQ (Purple lines) generally show lower and more volatile accuracy for the Q-Anchored method compared to PopQA and TriviaQA, indicating they may be more challenging or require different reasoning pathways.
4. **Model Scale Effect:** The larger Llama-3-70B model sustains high Q-Anchored accuracy deeper into its network (later layers) compared to the smaller Llama-3-8B, where the decline is more pronounced.
5. **A-Anchored Stability:** The A-Anchored method, while performing poorly, shows much less variance across layers, suggesting its performance is less dependent on specific layer-wise processing.
### Interpretation
This data strongly suggests that **how information is anchored or presented to the model (as a question vs. as an answer) fundamentally changes its internal processing and ultimate accuracy.** The Q-Anchored approach appears to activate a more effective, layer-specific processing pathway that builds up to a peak of understanding in the middle layers. The subsequent decline could indicate over-processing, interference, or a shift in the model's internal representation away from the specific QA task in its final layers.
The stark contrast between the two methods implies that the model's "knowledge" is not uniformly accessible; its ability to retrieve and apply that knowledge is highly contingent on the prompt format. The A-Anchored method's low, flat performance might represent a baseline or a failure mode where the model does not engage its specialized QA circuitry. The differences between datasets highlight that model performance is not monolithic but varies significantly with the nature of the knowledge or reasoning required. This analysis is crucial for understanding model internals and designing more effective prompting strategies.