## Line Graphs: Answer Accuracy Across Layers for Different Models and Datasets
### Overview
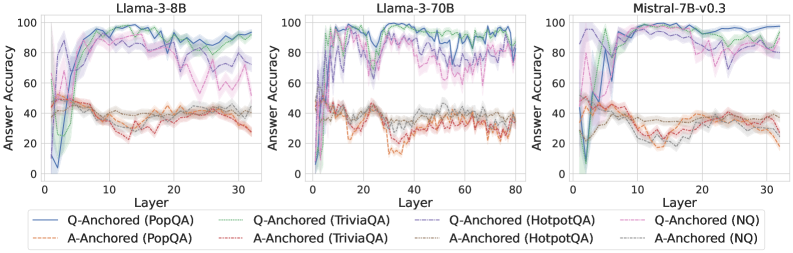
The image contains three line graphs comparing answer accuracy across transformer model layers for different architectures (Llama-3-8B, Llama-3-70B, Mistral-7B-v0.3) and datasets (PopQA, TriviaQA, HotpotQA, NQ). Each graph shows two anchoring methods: Q-Anchored (question-focused) and A-Anchored (answer-focused), with shaded regions indicating variability.
### Components/Axes
- **X-axis**: Layer number (0–30 for Llama-3-8B/Mistral-7B, 0–80 for Llama-3-70B)
- **Y-axis**: Answer Accuracy (%) (0–100)
- **Legends**:
- **Q-Anchored**: Solid lines (PopQA: blue, TriviaQA: green, HotpotQA: purple, NQ: pink)
- **A-Anchored**: Dashed lines (PopQA: orange, TriviaQA: gray, HotpotQA: red, NQ: dark gray)
- **Shading**: Represents confidence intervals or variability around each line.
### Detailed Analysis
#### Llama-3-8B
- **Q-Anchored (PopQA)**: Blue line starts at ~20% accuracy, peaks at ~85% by layer 10, then declines to ~60% by layer 30.
- **A-Anchored (PopQA)**: Orange line starts at ~40%, peaks at ~70% by layer 10, then drops to ~30% by layer 30.
- **TriviaQA**: Q-Anchored (green) peaks at ~90% by layer 15, declines to ~70%. A-Anchored (gray) peaks at ~60%, drops to ~40%.
- **HotpotQA**: Q-Anchored (purple) peaks at ~80% by layer 20, declines to ~60%. A-Anchored (red) peaks at ~50%, drops to ~30%.
- **NQ**: Q-Anchored (pink) peaks at ~75% by layer 10, declines to ~50%. A-Anchored (dark gray) peaks at ~45%, drops to ~25%.
#### Llama-3-70B
- **Q-Anchored (PopQA)**: Blue line peaks at ~90% by layer 20, declines to ~70% by layer 80.
- **A-Anchored (PopQA)**: Orange line peaks at ~75% by layer 20, declines to ~50% by layer 80.
- **TriviaQA**: Q-Anchored (green) peaks at ~95% by layer 40, declines to ~80%. A-Anchored (gray) peaks at ~70%, drops to ~50%.
- **HotpotQA**: Q-Anchored (purple) peaks at ~85% by layer 60, declines to ~70%. A-Anchored (red) peaks at ~60%, drops to ~40%.
- **NQ**: Q-Anchored (pink) peaks at ~80% by layer 40, declines to ~60%. A-Anchored (dark gray) peaks at ~55%, drops to ~35%.
#### Mistral-7B-v0.3
- **Q-Anchored (PopQA)**: Blue line peaks at ~90% by layer 10, declines to ~70% by layer 30.
- **A-Anchored (PopQA)**: Orange line peaks at ~70% by layer 10, declines to ~40% by layer 30.
- **TriviaQA**: Q-Anchored (green) peaks at ~85% by layer 15, declines to ~65%. A-Anchored (gray) peaks at ~60%, drops to ~40%.
- **HotpotQA**: Q-Anchored (purple) peaks at ~80% by layer 20, declines to ~60%. A-Anchored (red) peaks at ~50%, drops to ~30%.
- **NQ**: Q-Anchored (pink) peaks at ~75% by layer 10, declines to ~55%. A-Anchored (dark gray) peaks at ~45%, drops to ~25%.
### Key Observations
1. **Q-Anchored Methods**: Consistently show higher initial accuracy across all models/datasets but experience sharper declines as layers increase.
2. **A-Anchored Methods**: Start with lower accuracy but exhibit more gradual declines, suggesting better stability in deeper layers.
3. **Dataset Variability**:
- TriviaQA and NQ show the most pronounced layer-dependent performance drops.
- PopQA maintains higher accuracy in Q-Anchored configurations across all models.
4. **Shaded Regions**: Indicate significant variability in performance, particularly for A-Anchored methods in deeper layers (e.g., Llama-3-70B layer 60+).
### Interpretation
The data suggests that Q-Anchored methods prioritize early-layer question understanding, leading to strong initial performance but reduced effectiveness in deeper layers. A-Anchored methods, while starting weaker, may better maintain answer coherence in later layers. The dataset-specific trends imply that question complexity (e.g., TriviaQA/NQ) amplifies layer-dependent performance degradation. The shaded regions highlight the need for robustness testing, as variability increases with layer depth. These findings could inform model architecture design, emphasizing the trade-off between question comprehension and answer stability across transformer layers.