## Chart: Cumulative Probability vs. Peak Size
### Overview
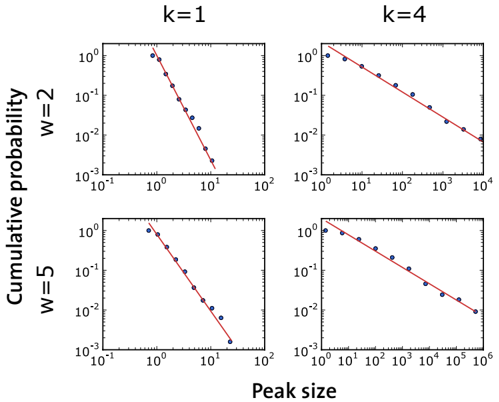
The image presents four scatter plots arranged in a 2x2 grid. Each plot displays the relationship between "Cumulative probability" (y-axis) and "Peak size" (x-axis) under different conditions, specified by the parameters 'k' and 'w'. Both axes are logarithmically scaled. The plots show a decreasing trend, with a red line of best fit overlaid on the blue scatter points.
### Components/Axes
* **Title:** The plots are implicitly titled by the parameters 'k' and 'w' displayed above and to the left of each plot, respectively.
* **X-axis:** "Peak size" with a logarithmic scale ranging from approximately 10<sup>-1</sup> to 10<sup>2</sup> for k=1 and from 10<sup>0</sup> to 10<sup>6</sup> for k=4.
* **Y-axis:** "Cumulative probability" with a logarithmic scale ranging from 10<sup>-3</sup> to 10<sup>0</sup>.
* **Data Points:** Blue scatter points representing the data.
* **Trend Line:** A red line of best fit is plotted through the data points in each graph.
* **Parameters:**
* k = 1 (top left and bottom left plots)
* k = 4 (top right and bottom right plots)
* w = 2 (top left and top right plots)
* w = 5 (bottom left and bottom right plots)
### Detailed Analysis
**Top-Left Plot (k=1, w=2):**
* X-axis: Peak size ranges from 10<sup>-1</sup> to 10<sup>2</sup>.
* Y-axis: Cumulative probability ranges from 10<sup>-3</sup> to 10<sup>0</sup>.
* Trend: The blue data points show a decreasing trend. The red line of best fit confirms this downward slope.
* Data Points:
* At Peak size ≈ 0.1, Cumulative probability ≈ 1
* At Peak size ≈ 1, Cumulative probability ≈ 0.1
* At Peak size ≈ 10, Cumulative probability ≈ 0.01
**Top-Right Plot (k=4, w=2):**
* X-axis: Peak size ranges from 10<sup>0</sup> to 10<sup>4</sup>.
* Y-axis: Cumulative probability ranges from 10<sup>-3</sup> to 10<sup>0</sup>.
* Trend: The blue data points show a decreasing trend. The red line of best fit confirms this downward slope.
* Data Points:
* At Peak size ≈ 1, Cumulative probability ≈ 1
* At Peak size ≈ 10, Cumulative probability ≈ 0.2
* At Peak size ≈ 100, Cumulative probability ≈ 0.05
* At Peak size ≈ 1000, Cumulative probability ≈ 0.01
* At Peak size ≈ 10000, Cumulative probability ≈ 0.002
**Bottom-Left Plot (k=1, w=5):**
* X-axis: Peak size ranges from 10<sup>-1</sup> to 10<sup>2</sup>.
* Y-axis: Cumulative probability ranges from 10<sup>-3</sup> to 10<sup>0</sup>.
* Trend: The blue data points show a decreasing trend. The red line of best fit confirms this downward slope.
* Data Points:
* At Peak size ≈ 0.1, Cumulative probability ≈ 1
* At Peak size ≈ 1, Cumulative probability ≈ 0.1
* At Peak size ≈ 10, Cumulative probability ≈ 0.01
**Bottom-Right Plot (k=4, w=5):**
* X-axis: Peak size ranges from 10<sup>0</sup> to 10<sup>6</sup>.
* Y-axis: Cumulative probability ranges from 10<sup>-3</sup> to 10<sup>0</sup>.
* Trend: The blue data points show a decreasing trend. The red line of best fit confirms this downward slope.
* Data Points:
* At Peak size ≈ 1, Cumulative probability ≈ 1
* At Peak size ≈ 10, Cumulative probability ≈ 0.2
* At Peak size ≈ 100, Cumulative probability ≈ 0.05
* At Peak size ≈ 1000, Cumulative probability ≈ 0.01
* At Peak size ≈ 10000, Cumulative probability ≈ 0.002
* At Peak size ≈ 100000, Cumulative probability ≈ 0.0005
* At Peak size ≈ 1000000, Cumulative probability ≈ 0.0001
### Key Observations
* All four plots exhibit a power-law relationship between peak size and cumulative probability, as indicated by the linear trend on the log-log scale.
* The parameter 'k' influences the range of peak sizes considered, with k=4 extending to larger peak sizes than k=1.
* The parameter 'w' seems to have a minor effect on the slope of the trend line, but this is difficult to quantify precisely without further analysis.
### Interpretation
The plots suggest that the cumulative probability of observing a certain peak size decreases as the peak size increases. This is a common characteristic of many natural phenomena, often modeled by power-law distributions. The different values of 'k' and 'w' likely represent different system parameters or conditions that affect the range and distribution of peak sizes. The fact that the relationship is linear on a log-log scale indicates a power-law relationship, which is often associated with scale-free phenomena. The parameter 'k' seems to control the range of peak sizes observed, while 'w' may influence the rate at which the cumulative probability decreases with increasing peak size. Further analysis would be needed to determine the exact functional relationship and the physical meaning of 'k' and 'w'.