## Diagram: Limitations and Mitigations in Retrieval Systems
### Overview
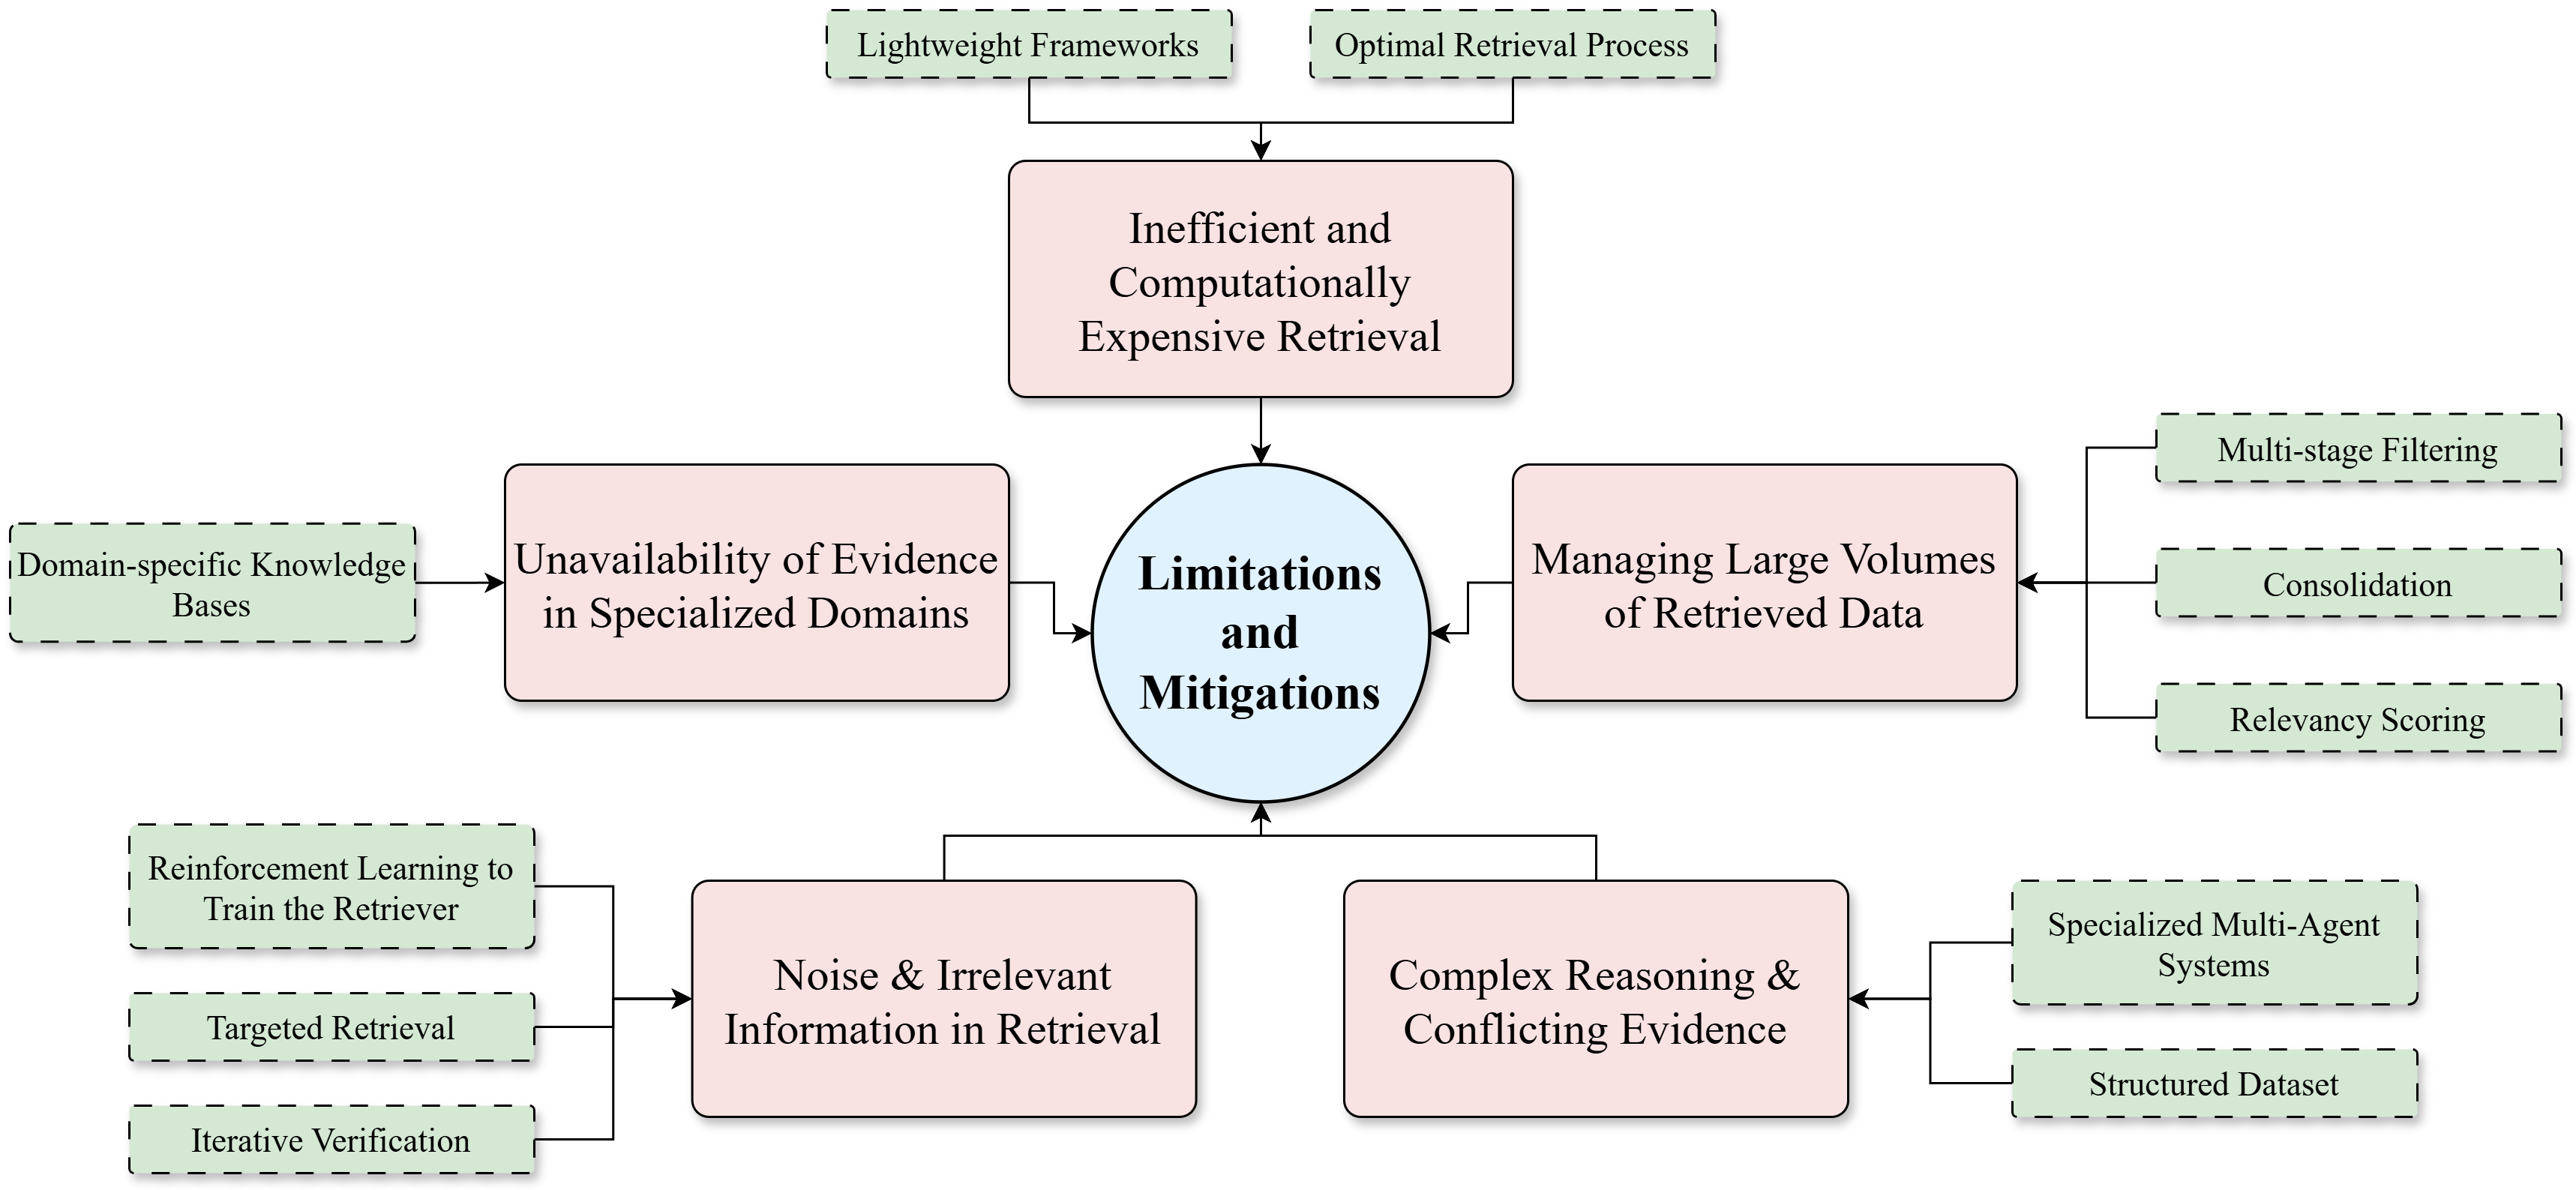
This image is a conceptual flowchart diagram illustrating the key limitations encountered in information retrieval systems and the corresponding mitigation strategies. The diagram is structured around a central theme, with specific problems (limitations) branching out and each being addressed by one or more solutions (mitigations). The visual design uses color-coding and directional arrows to show relationships.
### Components/Axes
The diagram has no numerical axes. Its components are text boxes and connecting arrows arranged in a hierarchical, radial layout.
* **Central Node (Blue Circle):** Located at the center of the diagram. Text: "Limitations and Mitigations".
* **Limitation Nodes (Pink Rectangles):** Five rectangular boxes with solid borders, colored light pink. Each represents a core limitation. They are connected to the central node by arrows pointing inward.
* **Mitigation Nodes (Green Dashed Boxes):** Multiple rectangular boxes with dashed borders, colored light green. Each represents a strategy to address a specific limitation. They are connected to their corresponding limitation node by arrows pointing inward.
* **Arrows:** Black lines with arrowheads indicate the flow of relationship, showing that mitigations address limitations, and all limitations contribute to the central theme.
### Detailed Analysis
The diagram is segmented into five primary branches, each consisting of a limitation and its associated mitigations.
**1. Top Branch (Limitation: Inefficient Retrieval)**
* **Limitation Node (Top Center):** "Inefficient and Computationally Expensive Retrieval"
* **Associated Mitigations (Top, above the limitation):**
* "Lightweight Frameworks"
* "Optimal Retrieval Process"
* **Flow:** Both mitigation boxes have arrows converging into the top of the "Inefficient..." limitation box.
**2. Left Branch (Limitation: Unavailability of Evidence)**
* **Limitation Node (Left Center):** "Unavailability of Evidence in Specialized Domains"
* **Associated Mitigation (Far Left):**
* "Domain-specific Knowledge Bases"
* **Flow:** The mitigation box has an arrow pointing right into the left side of the "Unavailability..." limitation box.
**3. Right Branch (Limitation: Managing Data Volume)**
* **Limitation Node (Right Center):** "Managing Large Volumes of Retrieved Data"
* **Associated Mitigations (Far Right, stacked vertically):**
* "Multi-stage Filtering"
* "Consolidation"
* "Relevancy Scoring"
* **Flow:** All three mitigation boxes have arrows converging into the right side of the "Managing..." limitation box.
**4. Bottom-Left Branch (Limitation: Noise & Irrelevance)**
* **Limitation Node (Bottom Left):** "Noise & Irrelevant Information in Retrieval"
* **Associated Mitigations (Far Bottom-Left, stacked vertically):**
* "Reinforcement Learning to Train the Retriever"
* "Targeted Retrieval"
* "Iterative Verification"
* **Flow:** All three mitigation boxes have arrows converging into the left side of the "Noise & Irrelevant..." limitation box.
**5. Bottom-Right Branch (Limitation: Complex Reasoning)**
* **Limitation Node (Bottom Right):** "Complex Reasoning & Conflicting Evidence"
* **Associated Mitigations (Far Bottom-Right, stacked vertically):**
* "Specialized Multi-Agent Systems"
* "Structured Dataset"
* **Flow:** Both mitigation boxes have arrows converging into the right side of the "Complex Reasoning..." limitation box.
### Key Observations
* **Symmetrical Structure:** The diagram is roughly symmetrical, with two limitations on the left, two on the right, and one at the top, all feeding into the central concept.
* **Clear Color Coding:** The consistent use of pink for problems and green for solutions creates an immediate visual distinction between challenges and responses.
* **Hierarchical Flow:** The arrows establish a clear hierarchy: Mitigations -> Limitations -> Central Theme. This visually argues that the central topic is defined by these specific problems and their proposed fixes.
* **Varied Mitigation Counts:** The number of mitigation strategies per limitation varies (from 1 to 3), suggesting some problems are more multifaceted or have a wider array of potential solutions than others.
### Interpretation
This diagram serves as a high-level taxonomy or conceptual map for understanding the challenges in building effective retrieval systems (e.g., for search engines, RAG systems, or knowledge bases) and the technical directions for overcoming them.
* **What it Demonstrates:** It posits that retrieval is not a monolithic problem but a set of distinct challenges: computational cost, data scarcity in niches, data overload, result quality (noise), and handling sophisticated reasoning with contradictory information.
* **Relationships:** The mitigations are directly paired with the limitations they are best suited to solve. For example, "Domain-specific Knowledge Bases" is a direct counter to the "Unavailability of Evidence in Specialized Domains." This creates a problem-solution framework.
* **Notable Patterns:** The diagram emphasizes a move towards more intelligent and structured retrieval processes. Solutions like "Reinforcement Learning," "Multi-Agent Systems," and "Iterative Verification" suggest that simple, one-shot retrieval is insufficient for complex tasks. The need for "Consolidation" and "Relevancy Scoring" highlights the post-retrieval processing required to make large result sets usable.
* **Underlying Message:** The central placement of "Limitations and Mitigations" implies that progress in retrieval technology is defined by this ongoing cycle of identifying bottlenecks and engineering targeted solutions. It frames the field as one of active problem-solving.