## Line Chart: Separation between true and false statements across layers
### Overview
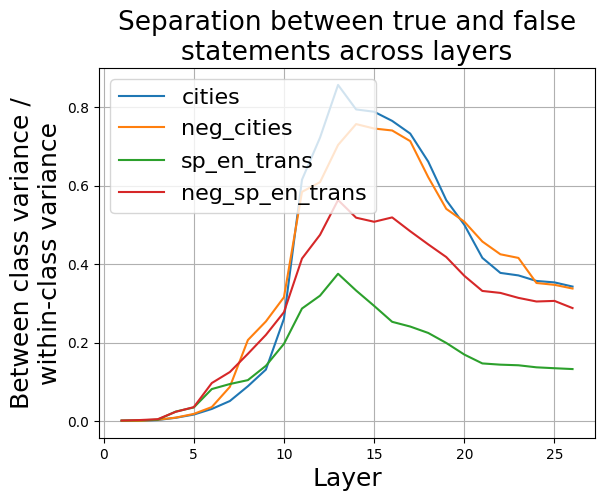
The image is a line chart that displays the separation between true and false statements across different layers. The y-axis represents the ratio of "Between class variance / within-class variance", and the x-axis represents the "Layer" number. Four different data series are plotted, each representing a different category: "cities", "neg_cities", "sp_en_trans", and "neg_sp_en_trans". The chart shows how the separation between true and false statements changes as the layer number increases for each category.
### Components/Axes
* **Title:** "Separation between true and false statements across layers"
* **X-axis:**
* Label: "Layer"
* Scale: 0 to 25 in increments of 5.
* **Y-axis:**
* Label: "Between class variance / within-class variance"
* Scale: 0.0 to 0.8 in increments of 0.2.
* **Legend:** Located in the top-left corner of the chart.
* "cities" - Teal line
* "neg\_cities" - Orange line
* "sp\_en\_trans" - Green line
* "neg\_sp\_en\_trans" - Brown line
### Detailed Analysis
* **Cities (Teal):** The "cities" line starts at approximately 0 at layer 0, increases to approximately 0.2 at layer 8, peaks at approximately 0.8 at layer 15, and then decreases to approximately 0.35 at layer 25.
* **neg\_cities (Orange):** The "neg\_cities" line starts at approximately 0 at layer 0, increases to approximately 0.75 at layer 13, peaks at approximately 0.75 at layer 15, and then decreases to approximately 0.35 at layer 25.
* **sp\_en\_trans (Green):** The "sp\_en\_trans" line starts at approximately 0 at layer 0, increases to approximately 0.38 at layer 13, and then decreases to approximately 0.13 at layer 25.
* **neg\_sp\_en\_trans (Brown):** The "neg\_sp\_en\_trans" line starts at approximately 0 at layer 0, increases to approximately 0.55 at layer 14, and then decreases to approximately 0.3 at layer 25.
### Key Observations
* The "cities" and "neg\_cities" categories show a similar trend, with a peak around layer 15 and a subsequent decrease.
* The "sp\_en\_trans" category has the lowest separation between true and false statements across all layers.
* All categories start with a separation of approximately 0 at layer 0.
* The "neg\_sp\_en\_trans" category peaks earlier than "cities" and "neg_cities".
### Interpretation
The chart suggests that the separation between true and false statements varies across different layers and categories. The "cities" and "neg\_cities" categories exhibit a higher degree of separation compared to "sp\_en\_trans" and "neg\_sp\_en\_trans". The peak separation around layer 15 for "cities" and "neg\_cities" might indicate that this layer is particularly effective at distinguishing between true and false statements for these categories. The lower separation for "sp\_en\_trans" suggests that this category might be more challenging to differentiate between true and false statements. The initial separation of 0 at layer 0 for all categories indicates that the model initially struggles to distinguish between true and false statements, and the separation improves as the layer number increases, up to a certain point.