## Line Chart: Separation between true and false statements across layers
### Overview
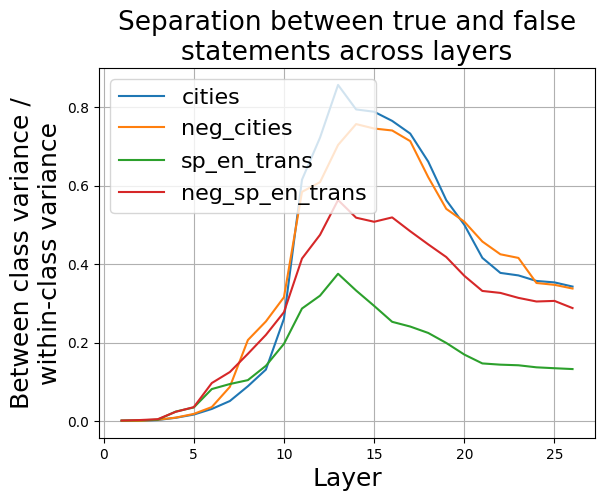
The chart visualizes the relationship between between-class variance and within-class variance across 25 layers for four distinct data categories. Four colored lines represent different classifications, showing how their separation metrics evolve through the layers.
### Components/Axes
- **Title**: "Separation between true and false statements across layers"
- **Y-axis**: "Between class variance / within-class variance" (range: 0.0 to 0.8)
- **X-axis**: "Layer" (integer values from 0 to 25)
- **Legend**: Located in top-left corner with four entries:
- Blue: cities
- Orange: neg_cities
- Green: sp_en_trans
- Red: neg_sp_en_trans
### Detailed Analysis
1. **Cities (Blue Line)**:
- Starts near 0.0 at layer 0
- Rises sharply to peak at ~0.8 between layers 10-12
- Declines gradually to ~0.35 by layer 25
2. **Neg_cities (Orange Line)**:
- Begins at 0.0, rises steeply
- Peaks at ~0.75 around layer 10
- Declines to ~0.3 by layer 25
3. **Sp_en_trans (Green Line)**:
- Starts at 0.0, rises gradually
- Peaks at ~0.35 around layer 12
- Declines to ~0.15 by layer 25
4. **Neg_sp_en_trans (Red Line)**:
- Begins at 0.0, rises steadily
- Peaks at ~0.5 around layer 10
- Declines to ~0.3 by layer 25
### Key Observations
- All lines show a similar pattern: initial growth, peak between layers 10-12, then gradual decline
- Cities (blue) and neg_cities (orange) exhibit the highest variance separation
- sp_en_trans (green) shows the lowest peak variance
- neg_sp_en_trans (red) demonstrates intermediate behavior
- All metrics drop below 0.4 after layer 15
### Interpretation
The data suggests that layers 10-12 represent optimal separation between true/false statements across all categories, with cities and neg_cities showing the strongest distinction. The subsequent decline indicates diminishing effectiveness of layer-based separation. The green line's lower peak suggests sp_en_trans has inherently weaker class separation compared to other categories. The parallel trends across all lines imply a shared architectural limitation in maintaining separation beyond layer 12, potentially indicating overfitting or diminishing returns in model complexity.