## Line Chart: Hits@10 Values vs. Training Epochs
### Overview
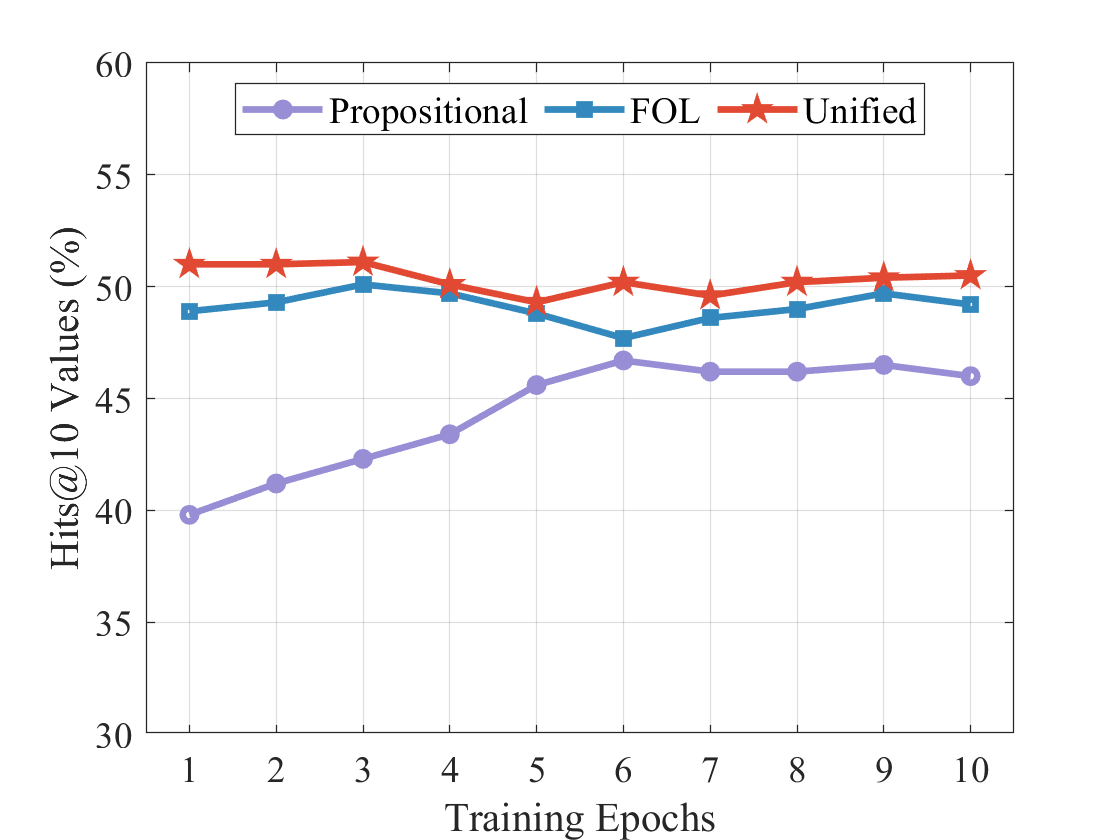
The image is a line chart comparing the performance of three different models (Propositional, FOL, and Unified) over 10 training epochs. The y-axis represents "Hits@10 Values (%)", ranging from 30 to 60. The x-axis represents "Training Epochs", ranging from 1 to 10. Each model is represented by a different colored line with a distinct marker.
### Components/Axes
* **Title:** None explicitly present in the image.
* **X-axis:**
* Label: "Training Epochs"
* Scale: 1 to 10, incrementing by 1.
* **Y-axis:**
* Label: "Hits@10 Values (%)"
* Scale: 30 to 60, incrementing by 5.
* **Legend:** Located at the top of the chart.
* Propositional: Purple line with circle markers.
* FOL: Blue line with square markers.
* Unified: Red line with star markers.
### Detailed Analysis
* **Propositional (Purple, Circle):** The line starts at approximately 40% at epoch 1, increases steadily to approximately 46.5% by epoch 6, and then plateaus around 46% for the remaining epochs.
* Epoch 1: ~40%
* Epoch 2: ~41.5%
* Epoch 3: ~42.5%
* Epoch 4: ~43.5%
* Epoch 5: ~45.8%
* Epoch 6: ~46.8%
* Epoch 7: ~46.2%
* Epoch 8: ~46.2%
* Epoch 9: ~46.5%
* Epoch 10: ~46%
* **FOL (Blue, Square):** The line starts at approximately 49% at epoch 1, increases slightly to approximately 50.5% by epoch 3, then decreases to approximately 48% by epoch 6, and then increases slightly to approximately 50.5% by epoch 9, and then decreases slightly to approximately 50% by epoch 10.
* Epoch 1: ~49%
* Epoch 2: ~49.3%
* Epoch 3: ~50.5%
* Epoch 4: ~50%
* Epoch 5: ~49.5%
* Epoch 6: ~47.8%
* Epoch 7: ~48.5%
* Epoch 8: ~49%
* Epoch 9: ~50.5%
* Epoch 10: ~50%
* **Unified (Red, Star):** The line starts at approximately 51% at epoch 1, increases slightly to approximately 51.3% by epoch 3, then decreases to approximately 49.5% by epoch 5, then increases slightly to approximately 50.5% by epoch 7, and then plateaus around 50.5% for the remaining epochs.
* Epoch 1: ~51%
* Epoch 2: ~51%
* Epoch 3: ~51.3%
* Epoch 4: ~50.3%
* Epoch 5: ~49.5%
* Epoch 6: ~50.3%
* Epoch 7: ~50.5%
* Epoch 8: ~50.3%
* Epoch 9: ~50.5%
* Epoch 10: ~50.8%
### Key Observations
* The "Unified" model consistently outperforms the "FOL" and "Propositional" models across all training epochs.
* The "Propositional" model shows the most significant improvement in performance during the initial training epochs (1-6), but plateaus afterward.
* The "FOL" and "Unified" models exhibit relatively stable performance throughout the training period, with minor fluctuations.
### Interpretation
The chart suggests that the "Unified" model is the most effective of the three models, achieving the highest "Hits@10 Values (%)" consistently. The "Propositional" model benefits the most from initial training, but its performance plateaus, indicating a potential limitation in its learning capacity. The "FOL" model shows moderate and relatively stable performance. The data implies that the "Unified" model may have a more robust architecture or training methodology that allows it to achieve better results compared to the other two models. The "Hits@10 Values (%)" metric likely represents the percentage of times the correct answer is within the top 10 predictions made by the model.