\n
## Line Chart: Hits@10 Values vs. Training Epochs
### Overview
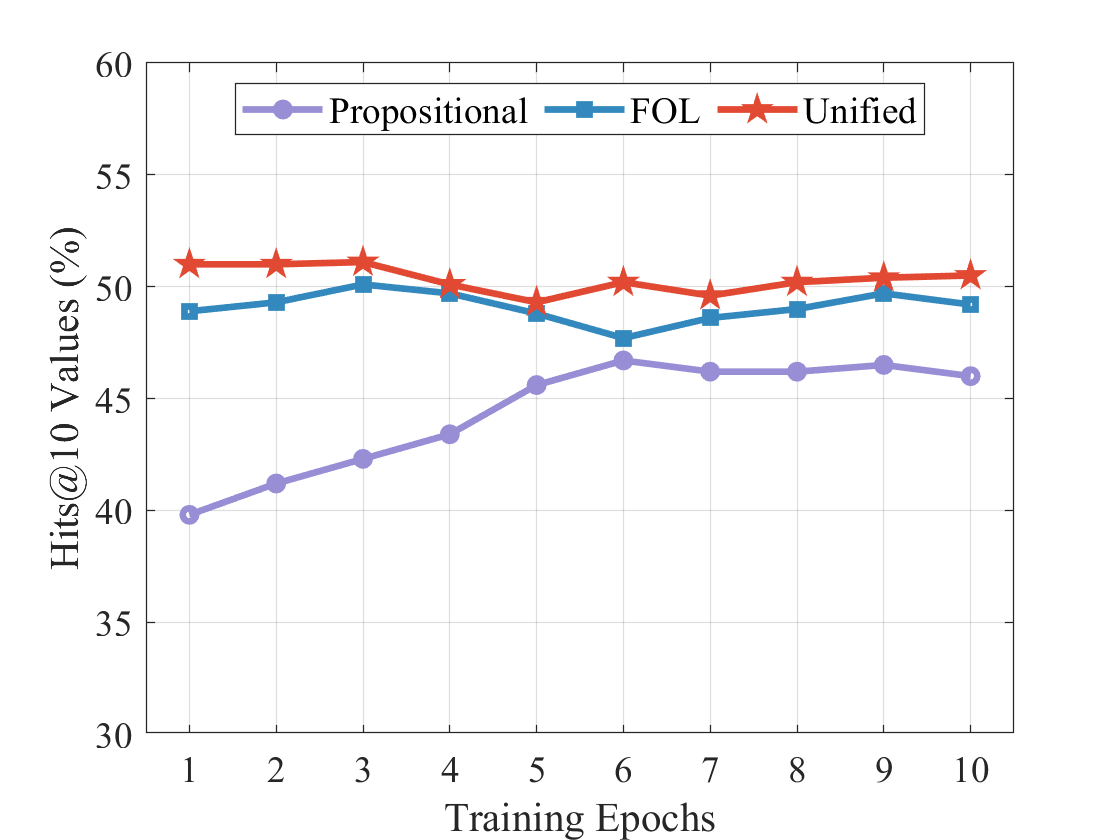
This line chart depicts the performance of three different approaches – Propositional, FOL (First-Order Logic), and Unified – over 10 training epochs. The performance metric is "Hits@10 Values (%)", representing the percentage of times the correct answer appears within the top 10 predicted values.
### Components/Axes
* **X-axis:** Training Epochs (ranging from 1 to 10)
* **Y-axis:** Hits@10 Values (%) (ranging from 30 to 60)
* **Legend:** Located at the top-center of the chart, identifying the three data series:
* Propositional (Purple line with circle markers)
* FOL (Blue line with square markers)
* Unified (Red line with star markers)
* **Gridlines:** Present to aid in reading values.
### Detailed Analysis
Let's analyze each line individually, noting trends and approximate data points.
* **Propositional (Purple):** This line shows an upward trend from Epoch 1 to Epoch 5, then plateaus.
* Epoch 1: ~40%
* Epoch 2: ~41%
* Epoch 3: ~42.5%
* Epoch 4: ~44%
* Epoch 5: ~46%
* Epoch 6: ~45.5%
* Epoch 7: ~45.5%
* Epoch 8: ~45.5%
* Epoch 9: ~45.5%
* Epoch 10: ~45.5%
* **FOL (Blue):** This line fluctuates throughout the 10 epochs, with a slight downward trend overall.
* Epoch 1: ~49%
* Epoch 2: ~49%
* Epoch 3: ~50%
* Epoch 4: ~48.5%
* Epoch 5: ~47%
* Epoch 6: ~47%
* Epoch 7: ~48%
* Epoch 8: ~48%
* Epoch 9: ~48%
* Epoch 10: ~48%
* **Unified (Red):** This line starts relatively high and exhibits a slight downward trend initially, then stabilizes and shows a slight increase towards the end.
* Epoch 1: ~52%
* Epoch 2: ~51%
* Epoch 3: ~51.5%
* Epoch 4: ~50.5%
* Epoch 5: ~49%
* Epoch 6: ~49%
* Epoch 7: ~49.5%
* Epoch 8: ~50%
* Epoch 9: ~50.5%
* Epoch 10: ~50.5%
### Key Observations
* The Propositional approach demonstrates the most significant improvement in Hits@10 values during the initial training epochs (1-5).
* The FOL approach exhibits the most stable performance, fluctuating around the 48-50% range.
* The Unified approach starts with the highest Hits@10 values but shows a slight decline before stabilizing.
* The Propositional approach ultimately reaches a performance level comparable to the FOL and Unified approaches.
* No approach reaches 60% Hits@10 values.
### Interpretation
The chart suggests that the Propositional approach benefits most from initial training, indicating it requires more epochs to converge. The FOL and Unified approaches achieve relatively stable performance early on, but their improvement plateaus. The Unified approach initially outperforms the others, but the gap closes as the Propositional approach improves.
The fact that none of the approaches reach a high level of accuracy (above 60%) suggests that the task is challenging, or that further improvements to the models or training process are needed. The differences in performance between the approaches could be due to the inherent limitations of each method in representing and reasoning about the underlying data. The plateauing of performance for all approaches after a certain number of epochs indicates diminishing returns from continued training, suggesting that the models may have reached their capacity to learn from the available data.