## Line Chart: Hits@10 Values over Training Epochs
### Overview
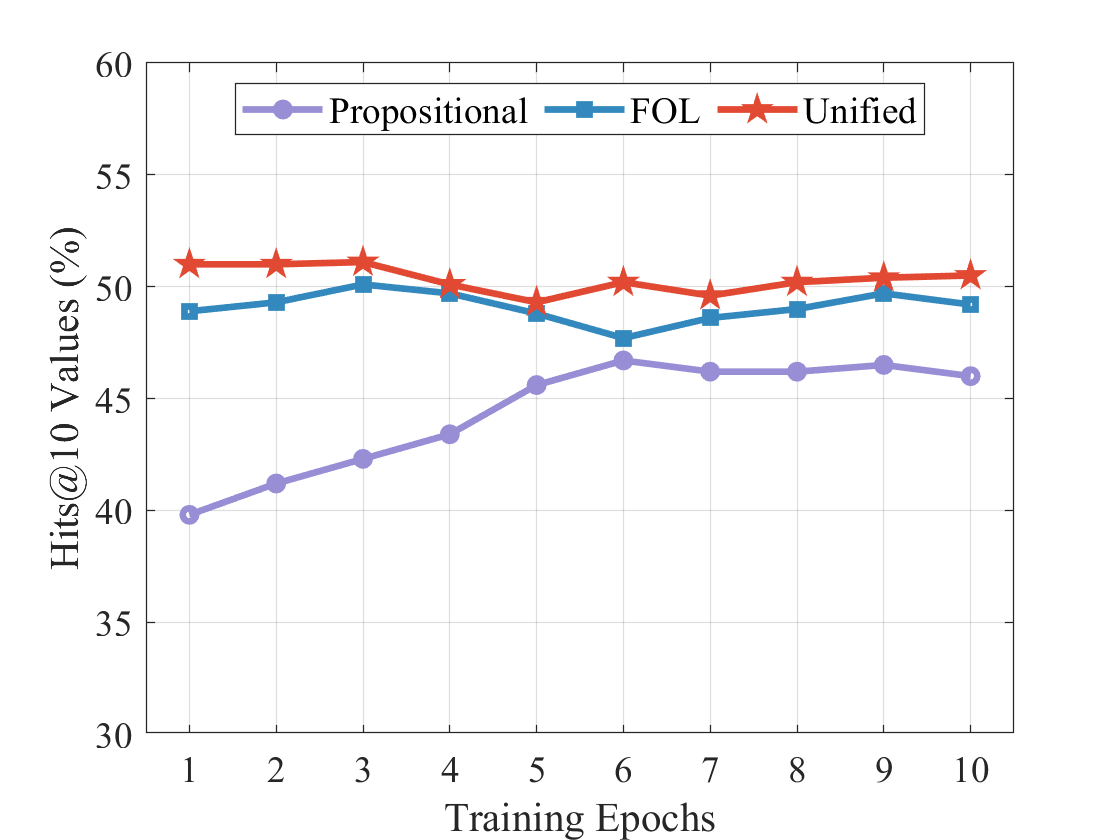
The image displays a line chart comparing the performance of three different methods or models—labeled "Propositional," "FOL," and "Unified"—over the course of 10 training epochs. The performance metric is "Hits@10 Values," measured as a percentage. The chart shows that the "Unified" method consistently achieves the highest performance, followed by "FOL," with "Propositional" starting the lowest but showing the most significant improvement over time.
### Components/Axes
* **Chart Type:** Multi-line chart with markers.
* **X-Axis:**
* **Label:** "Training Epochs"
* **Scale:** Linear, integer values from 1 to 10.
* **Y-Axis:**
* **Label:** "Hits@10 Values (%)"
* **Scale:** Linear, ranging from 30 to 60, with major tick marks every 5 units (30, 35, 40, 45, 50, 55, 60).
* **Legend:**
* **Position:** Top-center of the chart area, enclosed in a box.
* **Series:**
1. **Propositional:** Represented by a purple line with circular markers (●).
2. **FOL:** Represented by a blue line with square markers (■).
3. **Unified:** Represented by a red line with star markers (★).
### Detailed Analysis
**Data Series Trends and Approximate Values:**
1. **Propositional (Purple, Circles):**
* **Trend:** Shows a steady, monotonic upward trend throughout the training epochs. It starts as the lowest-performing method but closes the gap significantly.
* **Approximate Data Points:**
* Epoch 1: ~40.0%
* Epoch 2: ~41.2%
* Epoch 3: ~42.3%
* Epoch 4: ~43.4%
* Epoch 5: ~45.6%
* Epoch 6: ~46.8%
* Epoch 7: ~46.2%
* Epoch 8: ~46.2%
* Epoch 9: ~46.6%
* Epoch 10: ~46.0%
2. **FOL (Blue, Squares):**
* **Trend:** Starts high, peaks early, experiences a dip in the middle epochs, and then recovers to a stable level. It remains the second-best performer throughout.
* **Approximate Data Points:**
* Epoch 1: ~49.0%
* Epoch 2: ~49.4%
* Epoch 3: ~50.2% (Peak)
* Epoch 4: ~49.8%
* Epoch 5: ~49.0%
* Epoch 6: ~47.8% (Trough)
* Epoch 7: ~48.8%
* Epoch 8: ~49.2%
* Epoch 9: ~49.8%
* Epoch 10: ~49.4%
3. **Unified (Red, Stars):**
* **Trend:** Maintains a relatively flat and stable high performance across all epochs, with very minor fluctuations. It is consistently the top-performing method.
* **Approximate Data Points:**
* Epoch 1: ~51.0%
* Epoch 2: ~51.0%
* Epoch 3: ~51.2%
* Epoch 4: ~50.2%
* Epoch 5: ~49.4%
* Epoch 6: ~50.4%
* Epoch 7: ~49.8%
* Epoch 8: ~50.4%
* Epoch 9: ~50.6%
* Epoch 10: ~50.6%
### Key Observations
1. **Performance Hierarchy:** A clear and consistent hierarchy is established from the first epoch: Unified > FOL > Propositional. This order never changes.
2. **Convergence:** The "Propositional" method shows the most dramatic learning curve, improving by approximately 6 percentage points over 10 epochs. The gap between it and the other two methods narrows considerably.
3. **Stability vs. Volatility:** The "Unified" method is the most stable. The "FOL" method shows more volatility, particularly the notable dip at epoch 6. The "Propositional" method shows a smooth, learning-driven increase.
4. **Peak Performance:** The highest single value on the chart is achieved by the "Unified" method at epochs 1, 2, and 3 (~51.0-51.2%). The peak for "FOL" is at epoch 3 (~50.2%).
### Interpretation
This chart likely compares different logical reasoning or knowledge representation approaches ("Propositional" logic, "First-Order Logic" (FOL), and a "Unified" framework) within a machine learning context, evaluating their effectiveness on a retrieval or prediction task (measured by Hits@10).
The data suggests that the **"Unified" approach is superior and robust**, delivering high accuracy from the start and maintaining it without significant degradation. This implies it may combine the strengths of the other approaches or use a more effective underlying architecture.
The **"FOL" approach performs well but is less stable**, as evidenced by its mid-training dip. This could indicate sensitivity to certain training phases or data batches. Its early peak suggests it learns useful patterns quickly but may be prone to overfitting or interference before stabilizing.
The **"Propositional" approach starts with limited capability but demonstrates strong, consistent learning**. Its upward trajectory suggests that with more training epochs beyond 10, it might eventually converge with or even surpass the other methods, though it begins from a significant deficit. The chart captures it in a phase of active improvement.
Overall, the visualization argues for the effectiveness of the "Unified" method, showing it provides both the highest and most reliable performance across the observed training period.