## Line Graph: Hits@10 Values (%) vs Training Epochs
### Overview
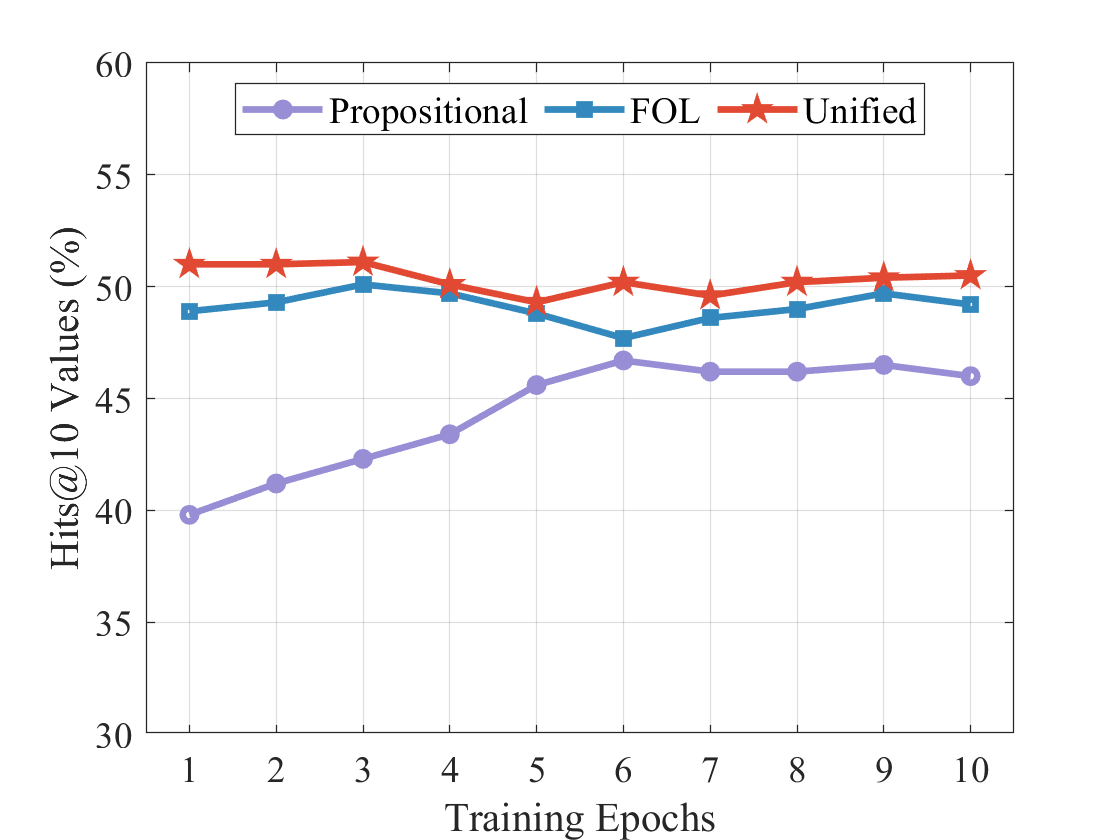
The graph compares three optimization methods (Proportional, FOL, Unified) across 10 training epochs, measuring Hits@10 performance in percentage. All three methods show distinct trends, with Unified maintaining the highest performance throughout.
### Components/Axes
- **X-axis**: Training Epochs (1–10, integer increments)
- **Y-axis**: Hits@10 Values (%) (30–60% range)
- **Legend**: Top-right corner, color-coded:
- Purple circles: Proportional
- Blue squares: FOL
- Red stars: Unified
- **Grid**: Light gray horizontal/vertical lines for reference
### Detailed Analysis
1. **Proportional (Purple Circles)**:
- Starts at 40% (Epoch 1)
- Gradual increase to 46% by Epoch 6
- Plateaus between 46–47% from Epoch 6–10
- *Trend*: Steady improvement in early epochs, then stabilization
2. **FOL (Blue Squares)**:
- Begins at 49% (Epoch 1)
- Peaks at 50% (Epoch 3)
- Dips to 48% (Epoch 6), then stabilizes at 49–50%
- *Trend*: Early volatility followed by consistent performance
3. **Unified (Red Stars)**:
- Starts at 51% (Epoch 1)
- Minor dip to 49% (Epoch 5)
- Maintains 50–51% from Epoch 6–10
- *Trend*: High stability with slight mid-epoch fluctuation
### Key Observations
- Unified method consistently outperforms others by 1–2% across all epochs
- Proportional shows the most significant improvement (6% gain) but remains lowest-performing
- FOL demonstrates initial superiority (Epoch 3 peak) but converges with Unified by later epochs
- All methods maintain >45% performance, indicating baseline effectiveness
### Interpretation
The data suggests:
1. **Unified method** offers optimal stability and performance for this task
2. **Proportional** requires more training (Epochs 1–6) to approach mid-tier performance
3. **FOL**'s early peak may indicate initial overfitting or aggressive optimization that later stabilizes
4. All methods plateau by Epoch 6–10, suggesting diminishing returns after ~6 epochs
The visual trends align precisely with numerical values: Proportional's upward slope matches its 40→46% increase, while Unified's flat line reflects its 51%→51% maintenance. The legend placement and color coding are unambiguous, with no conflicting data series. No anomalies detected beyond expected optimization curve patterns.