## Line Chart: Average Loss Across Token Positions for Different Models
### Overview
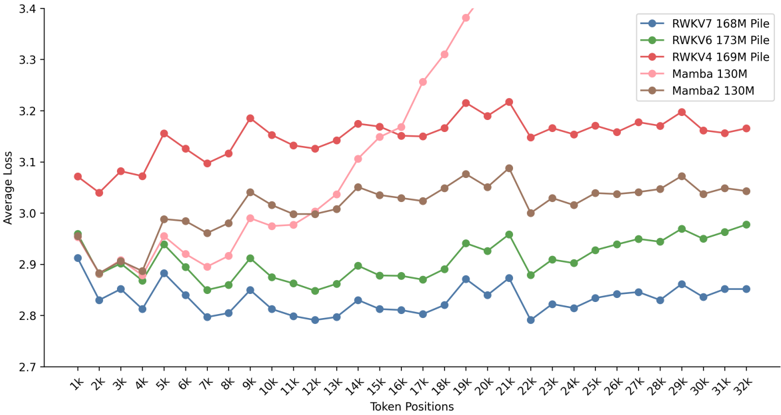
The chart displays five data series representing average loss values across token positions (1k to 32k) for different machine learning models. The y-axis ranges from 2.7 to 3.4, with each line corresponding to a specific model configuration.
### Components/Axes
- **X-axis (Token Positions)**: Labeled with increments of 1k (1k, 2k, ..., 32k).
- **Y-axis (Average Loss)**: Scaled from 2.7 to 3.4 in 0.1 increments.
- **Legend**: Located in the top-right corner, mapping colors to models:
- Blue: RWKV7 168M Pile
- Green: RWKV6 173M Pile
- Red: RWKV4 169M Pile
- Pink: Mamba 130M
- Brown: Mamba2 130M
### Detailed Analysis
1. **RWKV7 168M Pile (Blue)**:
- Starts at ~2.9 at 1k, showing a gradual downward trend to ~2.85 by 32k.
- Minor fluctuations observed between 2.8 and 2.9 throughout.
2. **RWKV6 173M Pile (Green)**:
- Begins at ~2.95 at 1k, fluctuates slightly upward to ~2.98 by 32k.
- Stable with minor oscillations between 2.85 and 2.95.
3. **RWKV4 169M Pile (Red)**:
- Starts at ~3.05 at 1k, remains relatively stable with minor fluctuations (~3.05–3.15).
- Peaks at ~3.15 near 20k before stabilizing.
4. **Mamba 130M (Pink)**:
- Begins at ~2.85 at 1k, sharp upward spike to ~3.35 near 18k.
- Stabilizes around ~3.15 after 20k, with minor fluctuations.
5. **Mamba2 130M (Brown)**:
- Starts at ~2.95 at 1k, fluctuates between ~2.9 and ~3.05.
- Peaks at ~3.05 near 20k, then stabilizes around ~3.0.
### Key Observations
- **RWKV4 169M Pile (Red)** exhibits the most stability, maintaining values between 3.05 and 3.15.
- **Mamba 130M (Pink)** shows a sharp, anomalous increase (~2.85 → 3.35) near 18k, followed by stabilization.
- **RWKV7 168M Pile (Blue)** demonstrates the most consistent downward trend (~2.9 → 2.85).
- **Mamba2 130M (Brown)** and **RWKV6 173M Pile (Green)** show moderate fluctuations but remain below 3.1.
### Interpretation
The data suggests performance variations across models and token positions. The RWKV4 169M Pile (red) maintains the highest average loss, indicating potential inefficiency or higher error rates. The Mamba 130M (pink) anomaly near 18k may reflect a specific issue in token processing or model behavior. The RWKV7 168M Pile (blue) shows the best performance, with a steady decline in loss, suggesting effective handling of token positions. The Mamba2 130M (brown) and RWKV6 173M Pile (green) exhibit intermediate performance, with minor fluctuations. The sharp rise in Mamba 130M highlights a critical divergence in behavior, warranting further investigation into its training dynamics or architectural differences.