# Technical Document Extraction: Multi-Graph Analysis
## Graph 1: Time (s)
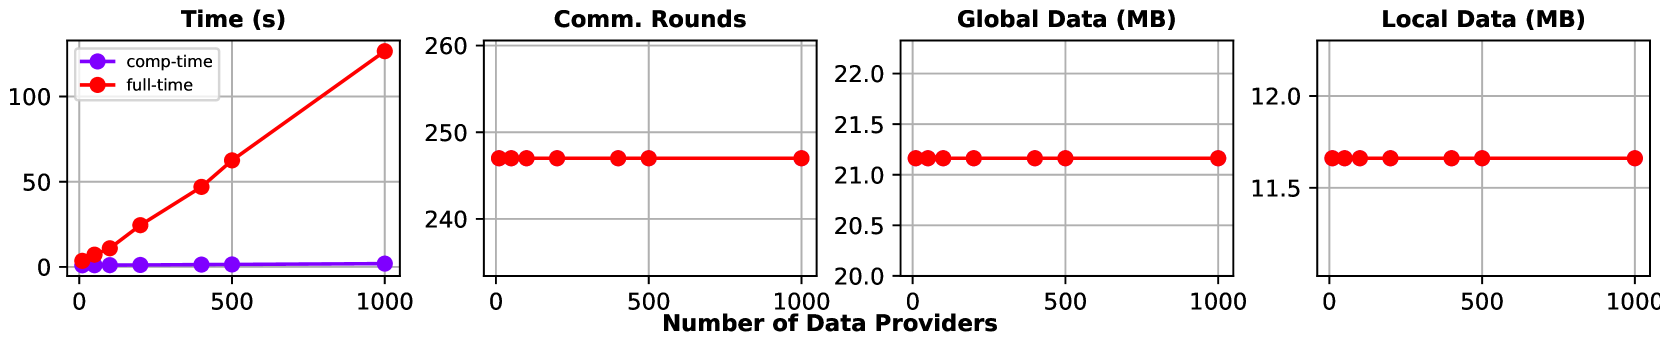
- **X-axis**: Number of Data Providers (0 to 1000)
- **Y-axis**: Time (seconds)
- **Legend**:
- Purple: `comp-time`
- Red: `full-time`
- **Trends**:
- `comp-time` remains constant near 0 seconds across all data providers.
- `full-time` increases linearly from ~0s to ~100s as data providers increase from 0 to 1000.
## Graph 2: Comm. Rounds
- **X-axis**: Number of Data Providers (0 to 1000)
- **Y-axis**: Communication Rounds (240 to 260)
- **Legend**:
- Red: `full-time`
- **Trends**:
- `full-time` communication rounds remain constant at ~250 across all data providers.
## Graph 3: Global Data (MB)
- **X-axis**: Number of Data Providers (0 to 1000)
- **Y-axis**: Global Data (MB) (20.0 to 22.0)
- **Legend**:
- Red: `full-time`
- **Trends**:
- `full-time` global data remains constant at ~21.1 MB across all data providers.
## Graph 4: Local Data (MB)
- **X-axis**: Number of Data Providers (0 to 1000)
- **Y-axis**: Local Data (MB) (11.5 to 12.0)
- **Legend**:
- Red: `full-time`
- **Trends**:
- `full-time` local data remains constant at ~11.5 MB across all data providers.
## Key Observations
1. **Time Complexity**:
- `full-time` scales linearly with the number of data providers.
- `comp-time` is independent of data provider count.
2. **Communication Efficiency**:
- Communication rounds remain stable despite increasing data providers.
3. **Data Volume**:
- Global and local data volumes are constant, suggesting fixed dataset sizes per provider.