## Chart Type: Line Graphs Comparing CIM-SFC and CIM-CFC
### Overview
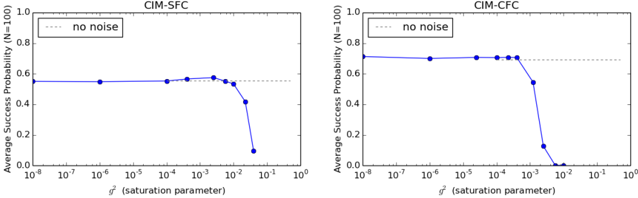
The image presents two line graphs side-by-side, comparing the Average Success Probability (N=100) against the saturation parameter (σ²) for two different configurations: CIM-SFC (left) and CIM-CFC (right). Both graphs also show a "no noise" baseline as a horizontal dotted line. The x-axis (saturation parameter) is displayed on a logarithmic scale.
### Components/Axes
* **Titles:**
* Left Graph: CIM-SFC
* Right Graph: CIM-CFC
* **Y-Axis (Both Graphs):**
* Label: Average Success Probability (N=100)
* Scale: 0.0 to 1.0, with increments of 0.2 (0.0, 0.2, 0.4, 0.6, 0.8, 1.0)
* **X-Axis (Both Graphs):**
* Label: σ² (saturation parameter)
* Scale: Logarithmic scale from 10⁻⁸ to 10⁰ (10⁻⁸, 10⁻⁷, 10⁻⁶, 10⁻⁵, 10⁻⁴, 10⁻³, 10⁻², 10⁻¹, 10⁰)
* **Legend (Both Graphs, Top-Left):**
* "no noise" - Represented by a gray dotted horizontal line.
### Detailed Analysis
**Left Graph: CIM-SFC**
* **Blue Line (Data Series):**
* Trend: The line remains relatively flat at approximately 0.55 from 10⁻⁸ to around 10⁻³, then sharply declines.
* Data Points:
* 10⁻⁸: ~0.55
* 10⁻⁶: ~0.55
* 10⁻⁴: ~0.55
* 10⁻³: ~0.57
* ~3 * 10⁻³: ~0.57
* ~6 * 10⁻³: ~0.55
* ~1.5 * 10⁻²: ~0.42
* ~3 * 10⁻²: ~0.09
* **Gray Dotted Line ("no noise"):**
* Horizontal line at approximately 0.55.
**Right Graph: CIM-CFC**
* **Blue Line (Data Series):**
* Trend: The line remains relatively flat at approximately 0.70 from 10⁻⁸ to around 10⁻⁴, then sharply declines.
* Data Points:
* 10⁻⁸: ~0.70
* 10⁻⁶: ~0.70
* 10⁻⁵: ~0.70
* 10⁻⁴: ~0.70
* ~3 * 10⁻⁴: ~0.70
* ~6 * 10⁻⁴: ~0.68
* ~1.5 * 10⁻³: ~0.55
* ~3 * 10⁻³: ~0.10
* ~6 * 10⁻³: ~0.01
* **Gray Dotted Line ("no noise"):**
* Horizontal line at approximately 0.70.
### Key Observations
* Both CIM-SFC and CIM-CFC show a stable average success probability at low saturation parameter values.
* The average success probability drops sharply for both configurations as the saturation parameter increases.
* CIM-CFC maintains a higher average success probability than CIM-SFC at lower saturation parameter values.
* The "no noise" baseline is higher for CIM-CFC than for CIM-SFC.
* The sharp decline in success probability occurs at a lower saturation parameter value for CIM-SFC compared to CIM-CFC.
### Interpretation
The graphs illustrate the impact of the saturation parameter (σ²) on the average success probability of two different configurations, CIM-SFC and CIM-CFC, with a fixed number of trials (N=100). The "no noise" baseline represents the ideal performance without any saturation effects.
The data suggests that CIM-CFC is more robust to the effects of the saturation parameter than CIM-SFC, as it maintains a higher success probability for a wider range of σ² values. The sharp decline in success probability indicates a critical threshold for the saturation parameter, beyond which the performance of both configurations degrades significantly. The difference in the "no noise" baselines suggests that CIM-CFC inherently performs better than CIM-SFC in the absence of saturation effects.
The trends indicate that controlling the saturation parameter is crucial for optimizing the performance of both CIM-SFC and CIM-CFC. The choice between the two configurations may depend on the expected range of saturation parameter values in a given application.