## Line Charts: CIM-SFC and CIM-CFC Performance vs. Saturation Parameter
### Overview
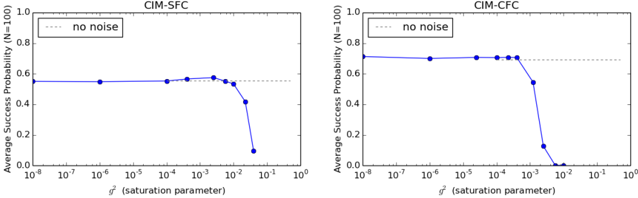
The image displays two side-by-side line charts comparing the performance of two systems or models, labeled "CIM-SFC" (left) and "CIM-CFC" (right). Both charts plot the "Average Success Probability" against a "saturation parameter" `q` on a logarithmic scale. The charts share identical axes and a common baseline reference line.
### Components/Axes
* **Chart Titles:** Left chart: "CIM-SFC". Right chart: "CIM-CFC".
* **Y-Axis (Both Charts):** Label: "Average Success Probability (N=100)". Scale: Linear, from 0.0 to 1.0, with major ticks at 0.0, 0.2, 0.4, 0.6, 0.8, 1.0.
* **X-Axis (Both Charts):** Label: "q (saturation parameter)". Scale: Logarithmic (base 10), ranging from 10⁻⁸ to 10⁰ (1). Major ticks are at each power of 10: 10⁻⁸, 10⁻⁷, 10⁻⁶, 10⁻⁵, 10⁻⁴, 10⁻³, 10⁻², 10⁻¹, 10⁰.
* **Legend (Both Charts):** Located in the top-left corner of each plot area. Contains a dashed gray line symbol and the text "no noise". This represents a baseline performance level.
* **Data Series (Both Charts):** Represented by solid blue lines connecting blue circular data points.
### Detailed Analysis
**CIM-SFC Chart (Left):**
* **Trend:** The success probability remains relatively stable for low values of `q`, then begins a gradual decline, which accelerates sharply after `q` exceeds approximately 10⁻².
* **Data Points (Approximate):**
* q = 10⁻⁸: Success Probability ≈ 0.55
* q = 10⁻⁶: Success Probability ≈ 0.55
* q = 10⁻⁴: Success Probability ≈ 0.55
* q = 10⁻³: Success Probability ≈ 0.56
* q ≈ 3 x 10⁻³ (midpoint between 10⁻³ and 10⁻²): Success Probability ≈ 0.58 (peak)
* q = 10⁻²: Success Probability ≈ 0.55
* q ≈ 3 x 10⁻²: Success Probability ≈ 0.40
* q = 10⁻¹: Success Probability ≈ 0.10
* **"no noise" Baseline:** The dashed gray line is positioned at y ≈ 0.55, aligning with the initial plateau of the CIM-SFC data.
**CIM-CFC Chart (Right):**
* **Trend:** The success probability starts at a higher level than CIM-SFC and remains perfectly flat for a wide range of low `q` values. It then experiences a very sharp, precipitous drop starting around `q = 10⁻³`.
* **Data Points (Approximate):**
* q = 10⁻⁸: Success Probability ≈ 0.70
* q = 10⁻⁶: Success Probability ≈ 0.70
* q = 10⁻⁴: Success Probability ≈ 0.70
* q = 10⁻³: Success Probability ≈ 0.70
* q ≈ 3 x 10⁻³: Success Probability ≈ 0.70
* q = 10⁻²: Success Probability ≈ 0.55
* q ≈ 3 x 10⁻²: Success Probability ≈ 0.10
* q = 10⁻¹: Success Probability ≈ 0.00 (or very near zero)
* **"no noise" Baseline:** The dashed gray line is positioned at y ≈ 0.70, aligning with the initial plateau of the CIM-CFC data.
### Key Observations
1. **Performance Plateau:** Both systems exhibit a performance plateau where success probability is insensitive to the saturation parameter `q` for values below a critical threshold (around 10⁻³ for CIM-CFC, and with a slight rise before 10⁻² for CIM-SFC).
2. **Critical Threshold & Collapse:** Both systems experience a performance collapse as `q` increases beyond their respective thresholds. The collapse is notably sharper and occurs at a slightly lower `q` value for CIM-CFC.
3. **Baseline Comparison:** The "no noise" baseline for CIM-CFC (≈0.70) is significantly higher than for CIM-SFC (≈0.55), indicating superior baseline performance for the CFC variant under ideal (non-saturating) conditions.
4. **Relative Robustness:** While CIM-CFC has higher initial performance, its decline is more abrupt. CIM-SFC shows a more gradual onset of degradation, suggesting a different response characteristic to the saturation parameter.
### Interpretation
These charts likely compare the robustness of two computational or communication schemes (SFC vs. CFC) under increasing system load or resource contention, modeled by the saturation parameter `q`. The "Average Success Probability" is the key performance metric.
The data suggests a fundamental trade-off:
* **CIM-CFC** offers higher peak performance (70% success) in low-saturation regimes but is highly brittle. Once saturation crosses a critical point (~10⁻³), its performance collapses catastrophically to near zero.
* **CIM-SFC** has lower peak performance (55% success) but demonstrates more graceful degradation. Its performance begins to decline earlier but falls less precipitously, maintaining some functionality (≈10% success) at saturation levels where CIM-CFC has completely failed.
The "no noise" line represents the theoretical or ideal performance limit for each system in the absence of the saturation effect being studied. The fact that the data plateaus at this line for low `q` confirms that saturation is the dominant performance-limiting factor in this experiment. The choice between SFC and CFC would therefore depend on the expected operating environment: CFC for consistently low-saturation conditions, and SFC for environments where occasional high saturation is possible and maintaining some functionality is critical.