## Line Graphs: CIM-SFC and CIM-CFC Performance vs. Saturation Parameter (g²)
### Overview
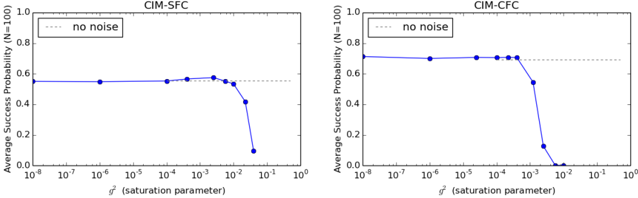
The image contains two side-by-side line graphs comparing the **Average Success Probability (N=100)** of two systems, **CIM-SFC** (left) and **CIM-CFC** (right), as a function of the **saturation parameter (g²)**. Both graphs include a dotted reference line labeled "no noise" at a success probability of 0.8. The x-axis spans g² values from 1e-8 to 1e0, while the y-axis ranges from 0.0 to 1.0.
---
### Components/Axes
- **X-axis**: Saturation parameter (g²), logarithmic scale (1e-8 to 1e0).
- **Y-axis**: Average Success Probability (N=100), linear scale (0.0 to 1.0).
- **Legends**:
- **CIM-SFC**: Solid blue line (left graph).
- **CIM-CFC**: Solid blue line (right graph).
- **No Noise**: Dotted gray line (both graphs).
- **Placement**:
- Legends are positioned in the **top-left** corner of each graph.
- Dotted "no noise" line spans the full width of both graphs.
---
### Detailed Analysis
#### CIM-SFC (Left Graph)
- **Trend**:
- Success probability remains **stable at ~0.55** for g² ≤ 1e-3.
- At g² = 1e-2, success probability **drops sharply to 0.1**.
- Further decline to **0.05** at g² = 1e-1.
- **Data Points**:
- g² = 1e-8: 0.55
- g² = 1e-7: 0.55
- g² = 1e-6: 0.55
- g² = 1e-5: 0.55
- g² = 1e-4: 0.56
- g² = 1e-3: 0.57
- g² = 1e-2: 0.1
- g² = 1e-1: 0.05
#### CIM-CFC (Right Graph)
- **Trend**:
- Success probability remains **stable at ~0.75** for g² ≤ 1e-3.
- At g² = 1e-2, success probability **drops sharply to 0.1**.
- Further decline to **0.01** at g² = 1e-1.
- **Data Points**:
- g² = 1e-8: 0.75
- g² = 1e-7: 0.75
- g² = 1e-6: 0.75
- g² = 1e-5: 0.75
- g² = 1e-4: 0.75
- g² = 1e-3: 0.75
- g² = 1e-2: 0.1
- g² = 1e-1: 0.01
---
### Key Observations
1. **Threshold Behavior**: Both systems maintain high success probabilities (0.55–0.75) for g² ≤ 1e-3, suggesting robustness in low-saturation regimes.
2. **Critical Drop**: A **sharp decline** occurs at g² = 1e-2 for both systems, indicating a critical saturation threshold.
3. **Divergence Post-Threshold**:
- CIM-CFC drops more steeply than CIM-SFC beyond g² = 1e-2 (0.1 → 0.01 vs. 0.1 → 0.05).
4. **No Noise Baseline**: The dotted line at 0.8 highlights ideal performance, unattained by either system under tested conditions.
---
### Interpretation
- **Saturation Impact**: The saturation parameter (g²) critically influences system performance. Both CIM-SFC and CIM-CFC exhibit similar behavior up to g² = 1e-3 but diverge significantly beyond this point.
- **Robustness**: CIM-SFC demonstrates marginally better resilience at higher g² values (e.g., 0.05 vs. 0.01 at g² = 1e-1), suggesting architectural or algorithmic differences in handling saturation.
- **Noise Sensitivity**: The absence of noise ("no noise" line) implies that real-world noise further degrades performance, as actual success probabilities are consistently below 0.8.
- **Design Implications**: Systems optimized for low-saturation environments (g² ≤ 1e-3) may require redesign or noise mitigation strategies for higher g² regimes.
---
### Language Note
All text in the image is in English. No non-English content is present.