## Diagram: Symbolic AI + LLM
### Overview
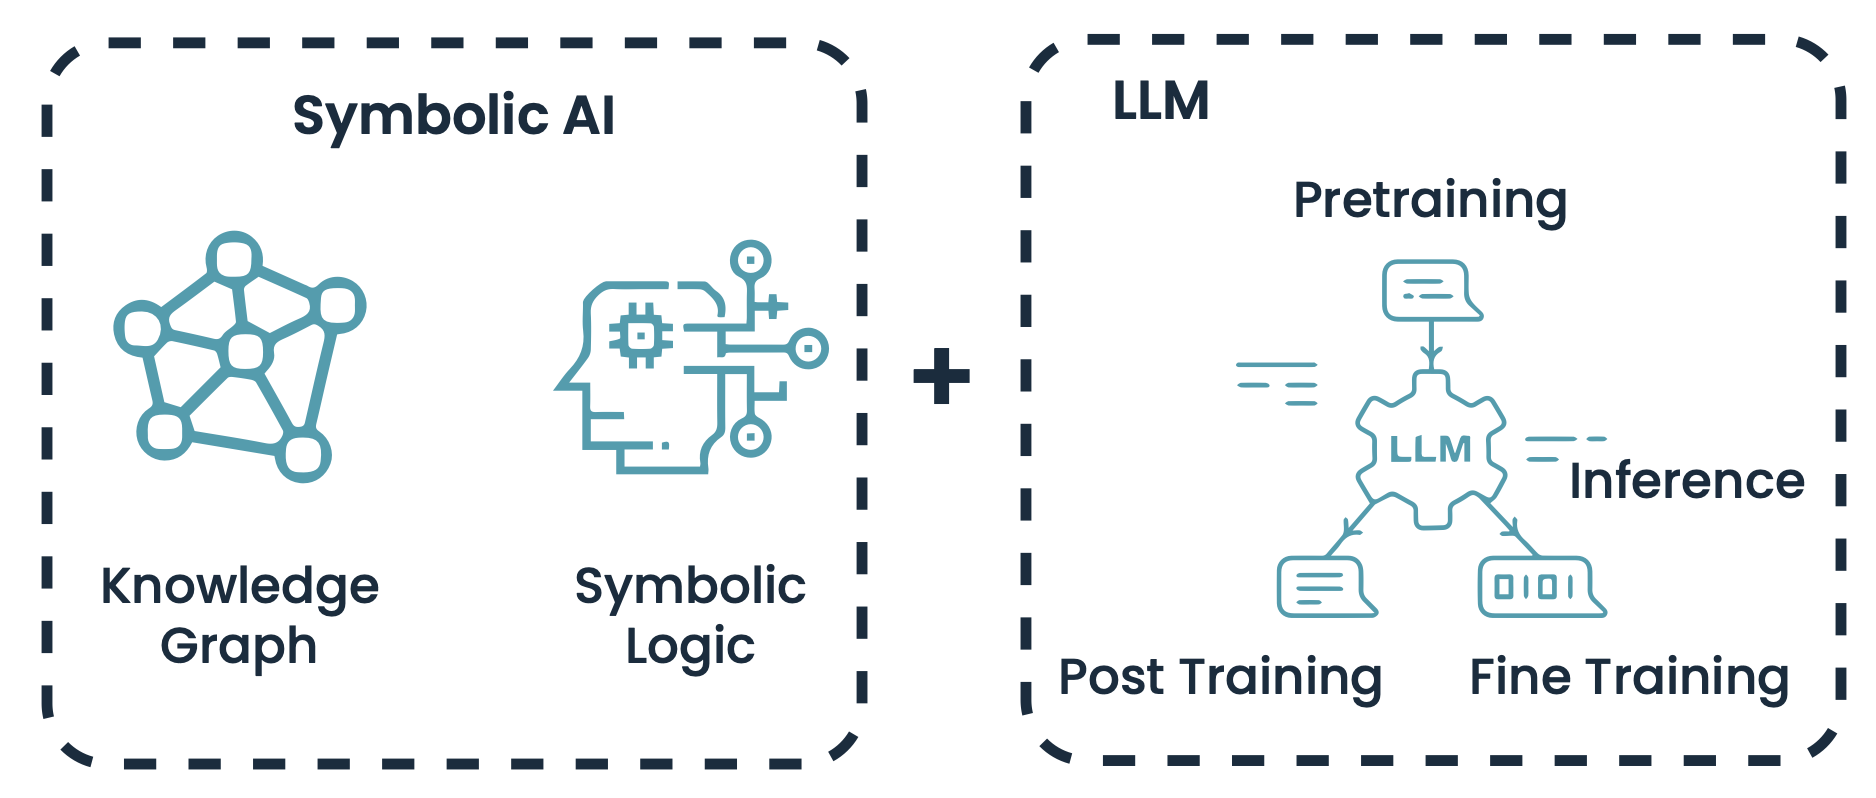
The image is a diagram illustrating the combination of Symbolic AI and Large Language Models (LLM). It shows two distinct components, "Symbolic AI" and "LLM," connected by a plus sign, suggesting their integration.
### Components/Axes
* **Symbolic AI (Left):**
* Enclosed in a dashed-line box labeled "Symbolic AI" at the top.
* Contains two sub-components:
* "Knowledge Graph": Represented by a network of interconnected nodes.
* "Symbolic Logic": Represented by a stylized head with a chip and connected nodes.
* **LLM (Right):**
* Enclosed in a dashed-line box labeled "LLM" at the top.
* Contains three sub-components connected to a central gear-shaped "LLM" icon:
* "Pretraining": An arrow points from a speech bubble icon to the LLM icon.
* "Post Training": An arrow points from the LLM icon to a speech bubble icon.
* "Fine Training": An arrow points from the LLM icon to a speech bubble icon containing "0101".
* "Inference": An arrow points from the LLM icon to the right, labeled "Inference".
* **Connector:** A plus sign "+" connects the two boxes, indicating the combination of Symbolic AI and LLM.
### Detailed Analysis or ### Content Details
* **Symbolic AI Box:**
* **Knowledge Graph:** The graph consists of approximately 7 nodes connected by edges.
* **Symbolic Logic:** The stylized head has a chip on the forehead and connections to three nodes on the right.
* **LLM Box:**
* **LLM Icon:** The central icon is a gear shape with "LLM" written inside.
* **Pretraining:** The arrow points downward from the speech bubble to the LLM icon.
* **Post Training:** The arrow points downward from the LLM icon to the speech bubble.
* **Fine Training:** The arrow points downward from the LLM icon to the speech bubble containing "0101".
* **Inference:** The arrow points horizontally to the right from the LLM icon, labeled "Inference".
### Key Observations
* The diagram emphasizes the integration of Symbolic AI and LLMs.
* The LLM component highlights the training stages: Pretraining, Post Training, and Fine Training.
* The "Inference" stage is shown as an output of the LLM.
### Interpretation
The diagram illustrates a hybrid AI approach that combines the strengths of Symbolic AI (knowledge representation and logical reasoning) with the capabilities of Large Language Models (pattern recognition and language generation). The plus sign suggests that these two approaches are complementary and can be integrated to create more powerful and versatile AI systems. The LLM component focuses on the training and inference process, indicating the importance of these stages in the overall system.