## Scatter Plot: electrical_engineering
### Overview
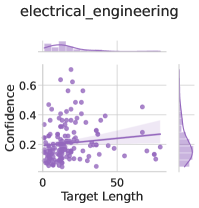
The image is a scatter plot titled "electrical_engineering". It displays the relationship between "Target Length" on the x-axis and "Confidence" on the y-axis. The plot includes marginal distributions (histograms and kernel density estimates) along both axes. The scatter plot shows individual data points, a regression line, and a confidence interval around the regression line.
### Components/Axes
* **Title:** electrical_engineering
* **X-axis:**
* Label: Target Length
* Scale: 0 to 100
* Markers: 0, 50
* **Y-axis:**
* Label: Confidence
* Scale: 0 to 0.6
* Markers: 0, 0.2, 0.4, 0.6
* **Data:**
* Data points are represented as purple dots.
* A purple regression line is plotted through the data points.
* A shaded purple region represents the confidence interval around the regression line.
* **Marginal Distributions:**
* Top: Histogram and kernel density estimate of "Target Length".
* Right: Histogram and kernel density estimate of "Confidence".
### Detailed Analysis
* **Target Length:** The x-axis ranges from approximately 0 to 100.
* **Confidence:** The y-axis ranges from 0 to 0.6.
* **Data Points:** The data points are concentrated at lower "Target Length" values (0-20) and "Confidence" values (0-0.2).
* **Regression Line:** The regression line has a slight positive slope, indicating a weak positive correlation between "Target Length" and "Confidence".
* **Marginal Distributions:**
* The "Target Length" distribution is skewed to the right, with most values concentrated at the lower end.
* The "Confidence" distribution is also skewed to the right, with a peak around 0.1-0.2.
### Key Observations
* Most data points are clustered in the lower-left corner of the plot, indicating that lower "Target Length" values are associated with lower "Confidence" values.
* There is a weak positive correlation between "Target Length" and "Confidence", as indicated by the slightly upward-sloping regression line.
* The marginal distributions show that both "Target Length" and "Confidence" are skewed towards lower values.
### Interpretation
The scatter plot suggests a weak positive relationship between "Target Length" and "Confidence" in the context of "electrical_engineering". The concentration of data points at lower values indicates that shorter target lengths tend to be associated with lower confidence levels. The slight positive slope of the regression line suggests that as the target length increases, the confidence level tends to increase slightly, but the relationship is not strong. The skewed distributions of both variables indicate that lower values are more common than higher values. This could imply that in electrical engineering tasks, shorter targets are more frequent, and confidence levels tend to be lower overall.