\n
## Scatter Plot with Marginal Distributions: electrical_engineering
### Overview
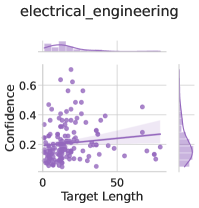
The image is a statistical visualization, specifically a scatter plot with marginal distribution plots (histograms/density plots) on the top and right sides. It displays the relationship between two variables, "Target Length" and "Confidence," for a dataset labeled "electrical_engineering." The plot uses a single color (purple) for all data points and includes a fitted trend line.
### Components/Axes
* **Title:** "electrical_engineering" (centered at the top).
* **X-Axis:**
* **Label:** "Target Length" (centered below the axis).
* **Scale:** Linear scale from 0 to approximately 80, with major tick marks labeled at 0 and 50.
* **Y-Axis:**
* **Label:** "Confidence" (rotated 90 degrees, centered to the left of the axis).
* **Scale:** Linear scale from 0.0 to approximately 0.7, with major tick marks labeled at 0.2, 0.4, and 0.6.
* **Data Series:**
* A scatter of purple circular points.
* A solid, darker purple trend line (likely a linear regression fit) running through the data.
* **Marginal Plots:**
* **Top Marginal Plot:** A distribution plot (appears to be a histogram with a density curve overlay) for the "Target Length" variable. It is positioned directly above the main scatter plot, sharing the same x-axis.
* **Right Marginal Plot:** A distribution plot for the "Confidence" variable. It is positioned to the right of the main scatter plot, sharing the same y-axis.
* **Legend:** There is no explicit legend box. The color purple is used consistently for all data elements (points, trend line, marginal distributions).
### Detailed Analysis
* **Data Distribution & Range:**
* **Target Length (X-axis):** Data points are densely concentrated between 0 and 50, with a few sparse points extending to around 80. The top marginal plot confirms a right-skewed distribution, with the highest frequency (peak) near the lower end (approximately 0-20) and a long tail extending to the right.
* **Confidence (Y-axis):** Data points are primarily clustered between 0.1 and 0.5, with some outliers reaching up to ~0.65. The right marginal plot shows a distribution that is somewhat right-skewed, with a peak around 0.2-0.3.
* **Trend Line:** The fitted line shows a **slight positive slope**. It starts at a Confidence value of approximately 0.2 when Target Length is 0 and rises to a Confidence of approximately 0.3 when Target Length is 80. This suggests a weak positive correlation between the two variables.
* **Spatial Grounding & Scatter Pattern:** The highest density of points is in the lower-left quadrant of the plot (low Target Length, low-to-moderate Confidence). The scatter is quite broad, indicating high variance in Confidence for any given Target Length, especially in the 0-40 range. There are no distinct clusters or gaps.
### Key Observations
1. **Weak Positive Correlation:** The primary trend is a modest increase in Confidence as Target Length increases, but the relationship is not strong.
2. **High Variance:** For short to medium Target Lengths (0-40), Confidence values vary widely from ~0.1 to ~0.6, indicating that Target Length alone is a poor predictor of Confidence in this range.
3. **Right-Skewed Distributions:** Both variables exhibit right-skewed distributions, meaning most data points have lower values, with fewer instances of very high Target Length or very high Confidence.
4. **Potential Outliers:** A few data points with Confidence > 0.6 are visible, primarily associated with Target Lengths between 10 and 30.
### Interpretation
This chart likely analyzes the performance of a model or system within the domain of "electrical_engineering." "Target Length" could refer to the length of a code sequence, a design specification, or a problem description. "Confidence" likely represents the model's confidence score in its output or prediction.
The data suggests that **longer targets are associated with a slight, but not reliable, increase in model confidence.** The weak correlation and high variance imply that other factors not visualized here (e.g., problem complexity, data quality, specific sub-domain) have a much stronger influence on the model's confidence than just the length of the target. The right-skewed distributions indicate that the dataset is dominated by shorter, less complex targets where the model's confidence is generally low to moderate. The presence of high-confidence outliers for shorter targets warrants investigation to understand what specific characteristics lead to high confidence in those cases.