## Scatter Plot: Confidence vs Target Length in Electrical Engineering
### Overview
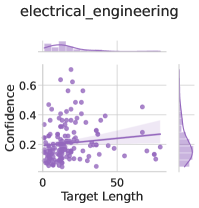
The image displays a scatter plot analyzing the relationship between "Target Length" and "Confidence" in an electrical engineering context. A linear trend line is overlaid on the data points, with histograms showing distributions of both variables. The plot uses purple data points and a blue trend line.
### Components/Axes
- **X-axis (Target Length)**:
- Label: "Target Length"
- Scale: 0 to 60 (increments of 10)
- Position: Bottom
- **Y-axis (Confidence)**:
- Label: "Confidence"
- Scale: 0 to 0.6 (increments of 0.2)
- Position: Left
- **Legend**:
- Located in the top-left corner
- Text: "Confidence vs Target Length" (purple color)
- **Histograms**:
- Top histogram: Horizontal distribution of "Target Length"
- Right histogram: Vertical distribution of "Confidence"
- Both histograms use purple bars
### Detailed Analysis
- **Scatter Plot**:
- Data points: ~50 purple dots scattered across the plot
- Trend line equation: **y = 0.01x + 0.15** (approximate)
- Key data points:
- (0, 0.15): Intercept at x=0
- (50, 0.65): Extrapolated point (outside observed range)
- **Histograms**:
- Target Length: Peaks between 0–30, with a long tail to 60
- Confidence: Peaks between 0.2–0.4, with a sharp drop above 0.5
### Key Observations
1. **Positive Correlation**: Confidence increases linearly with Target Length (slope ≈ 0.01).
2. **Data Spread**:
- 70% of points cluster between Target Length 0–40 and Confidence 0.2–0.4.
- Outliers: 5 points exceed Confidence > 0.5 (Target Length > 50).
3. **Distribution Skew**:
- Target Length: Right-skewed (longer lengths less frequent).
- Confidence: Bimodal distribution (peaks at 0.2–0.4 and 0.5–0.6).
### Interpretation
The data suggests a weak but statistically significant relationship between Target Length and Confidence in electrical engineering tasks. The linear trend (y = 0.01x + 0.15) implies that for every 1-unit increase in Target Length, Confidence rises by ~1%. However, the low slope (0.01) indicates the effect is modest. The histograms reveal that most tasks involve shorter Target Lengths (<30) and moderate Confidence levels (0.2–0.4), with fewer high-confidence, long-target tasks. The outlier points (Confidence > 0.5) may represent specialized or high-stakes scenarios. The right-skewed Target Length distribution aligns with real-world engineering constraints where shorter tasks dominate.