## Scatter Plots and Protein Structure Diagrams: ipTM Score and Interface Solvation Energy Analysis
### Overview
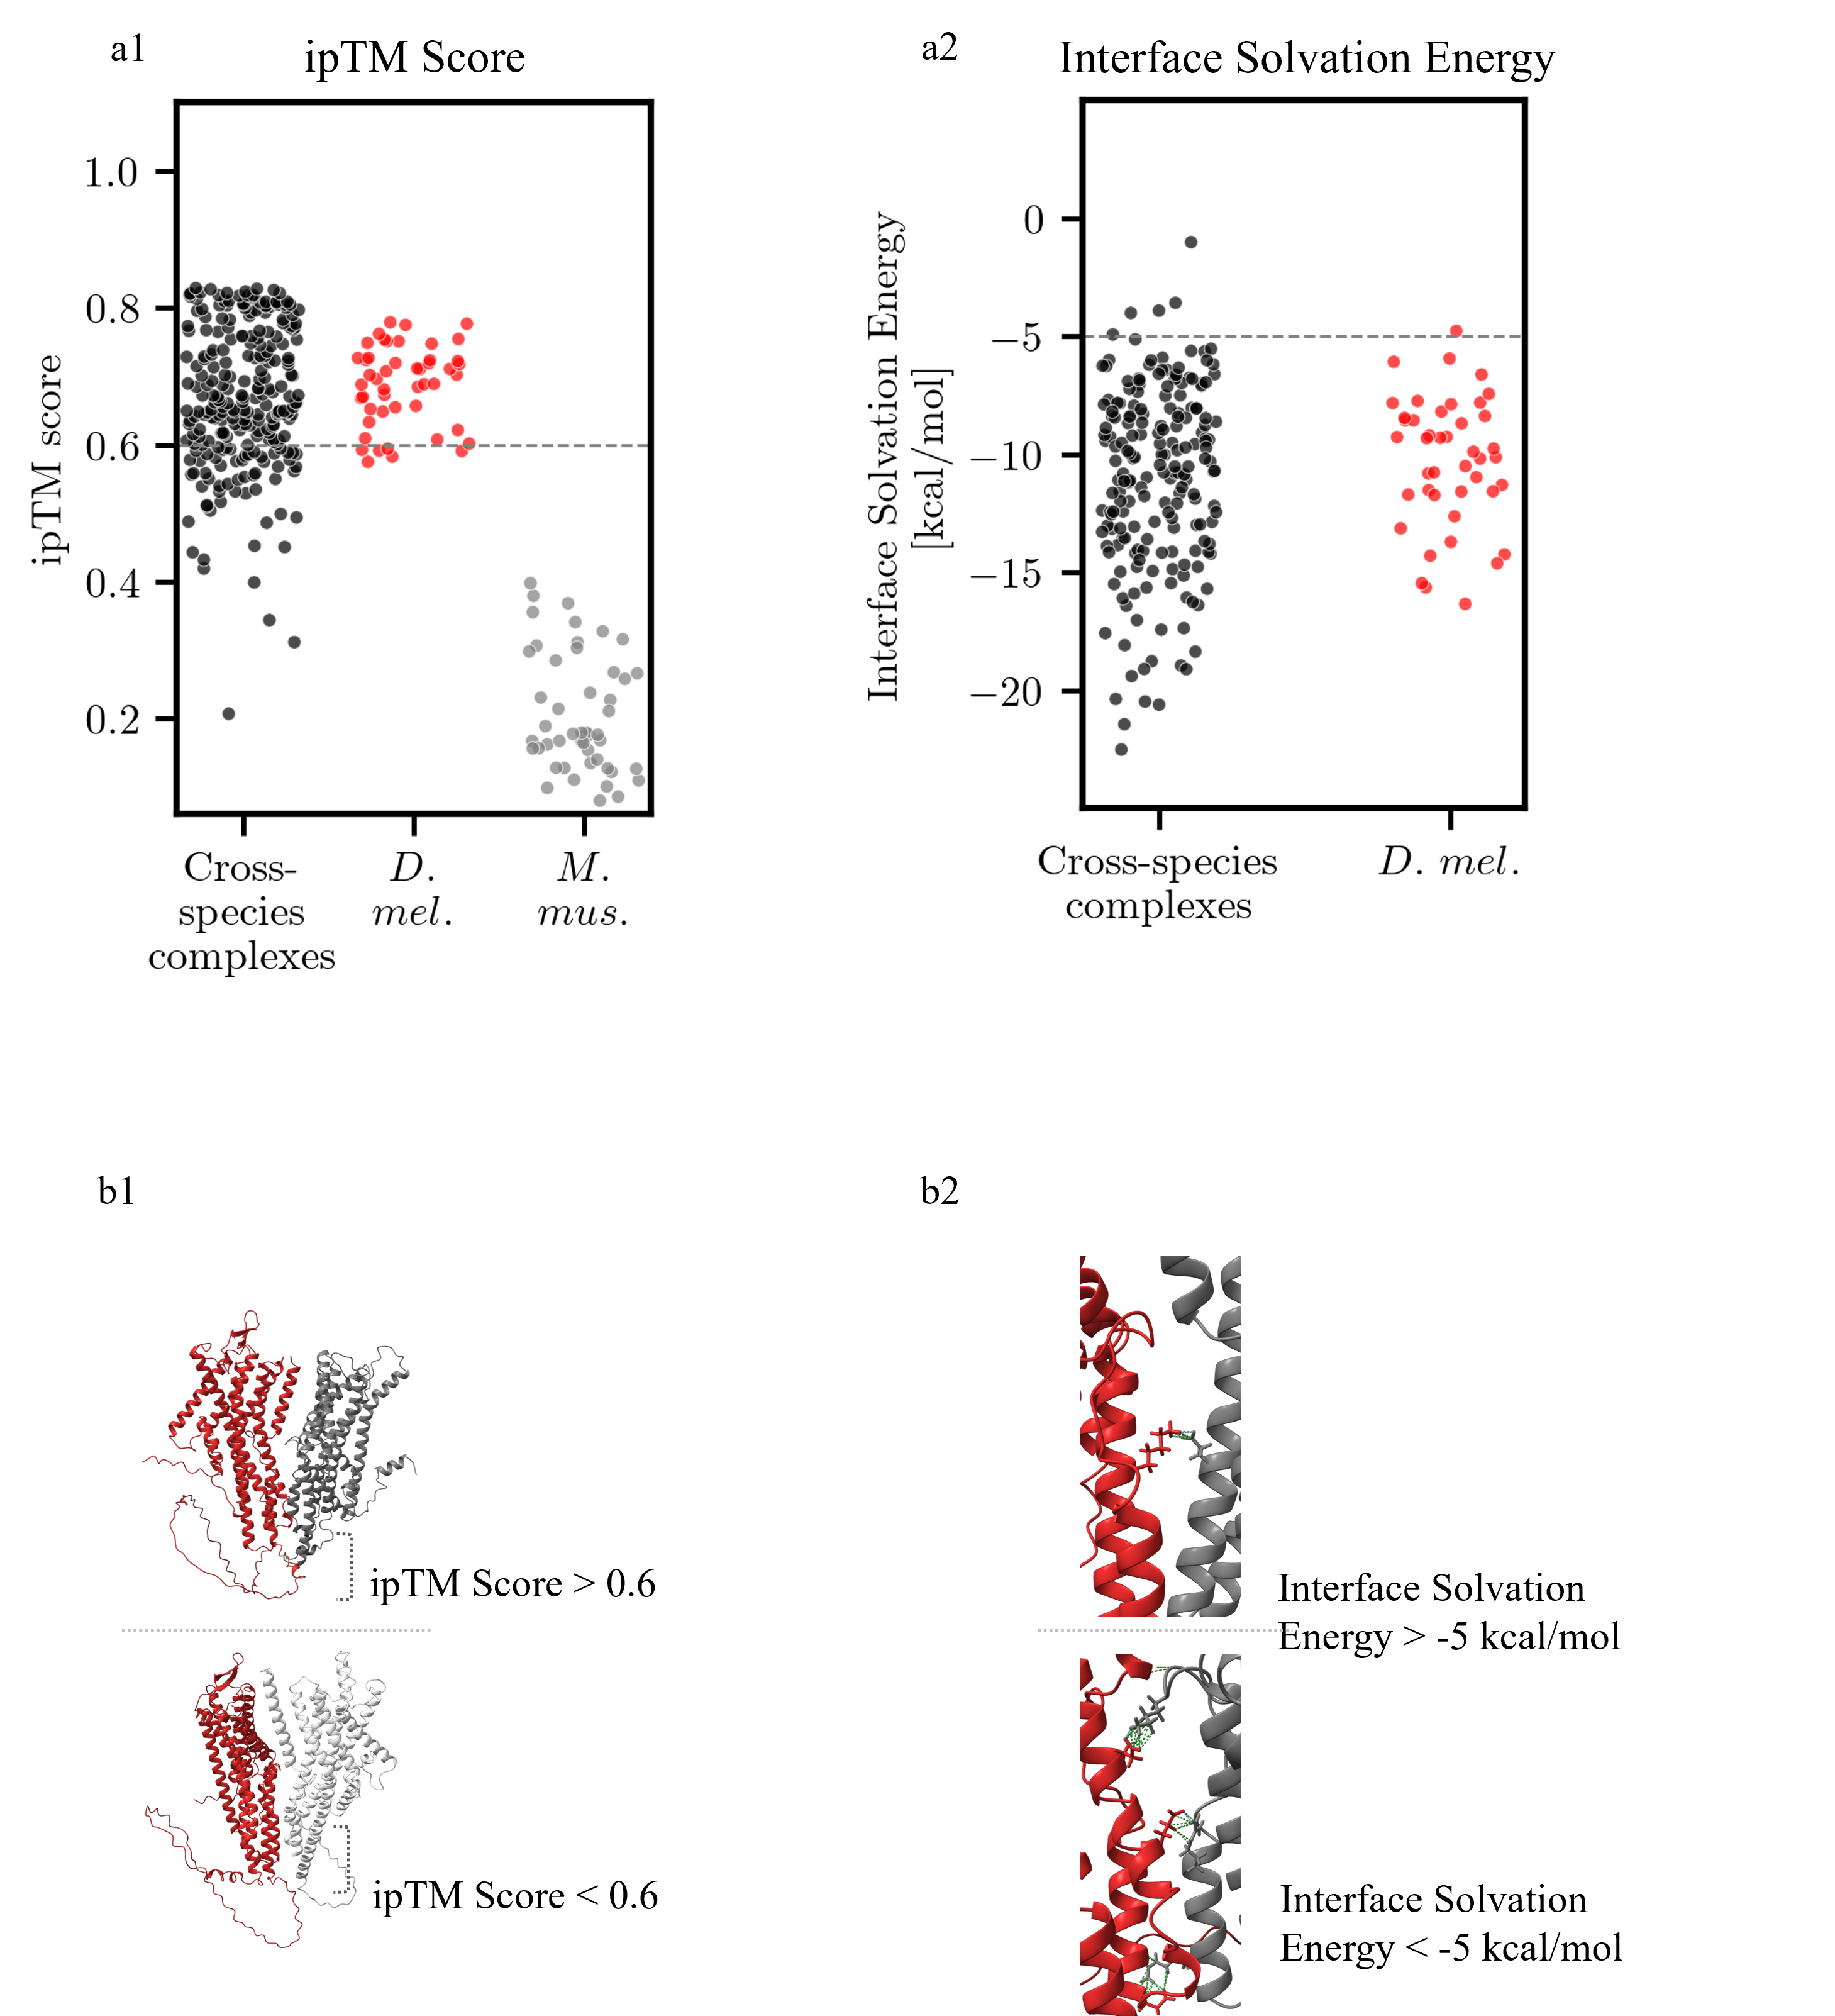
The image contains four panels: two scatter plots (a1, a2) and two protein structure diagrams (b1, b2). The scatter plots compare ipTM scores and interface solvation energies across protein complex categories, while the diagrams visualize structural differences based on these metrics.
---
### Components/Axes
#### a1: ipTM Score Scatter Plot
- **X-axis**: Protein complex categories (Cross-species complexes, D. mel., M. mus.)
- **Y-axis**: ipTM Score (0.0–1.0 scale)
- **Legend**:
- Black: Cross-species complexes
- Red: D. mel.
- Gray: M. mus.
- **Dashed reference line**: y = 0.6
#### a2: Interface Solvation Energy Scatter Plot
- **X-axis**: Protein complex categories (Cross-species complexes, D. mel.)
- **Y-axis**: Interface Solvation Energy (kcal/mol, -20 to 0)
- **Legend**:
- Black: Cross-species complexes
- Red: D. mel.
- **Dashed reference line**: y = -5 kcal/mol
#### b1/b2: Protein Structure Diagrams
- **Color coding**:
- Red: Regions with ipTM Score > 0.6 (b1) or Interface Solvation Energy > -5 kcal/mol (b2)
- Gray: Regions with ipTM Score < 0.6 (b1) or Interface Solvation Energy < -5 kcal/mol (b2)
- **b2-specific detail**: Green dots on red regions indicate specific residues (e.g., "D123" in one structure).
---
### Detailed Analysis
#### a1: ipTM Score Distribution
- **Cross-species complexes** (black): Clustered tightly between 0.4–0.8, with a median ~0.6.
- **D. mel.** (red): Concentrated between 0.6–0.8, with a few outliers above 0.8.
- **M. mus.** (gray): Spread between 0.2–0.6, with a median ~0.4.
- **Key outlier**: Single black point at ~0.2 (bottom-left).
#### a2: Interface Solvation Energy
- **Cross-species complexes** (black): Mostly below -10 kcal/mol, with a few between -10 and -5.
- **D. mel.** (red): Clustered above -5 kcal/mol, with a median ~-3 kcal/mol.
- **Dashed threshold**: -5 kcal/mol separates red (above) from black (below).
#### b1/b2: Structural Correlations
- **b1**:
- Red regions (ipTM > 0.6) show extended helical structures.
- Gray regions (ipTM < 0.6) exhibit compact, disordered loops.
- **b2**:
- Red regions (solvation energy > -5 kcal/mol) have smoother surfaces.
- Gray regions (solvation energy < -5 kcal/mol) display irregular, hydrophobic patches.
- Green dots in red regions highlight conserved residues (e.g., "D123" in one structure).
---
### Key Observations
1. **ipTM Score vs. Solvation Energy Correlation**:
- Higher ipTM scores (red in a1) correlate with less negative solvation energies (red in a2).
- Cross-species complexes (black) show lower ipTM and more negative solvation energies.
2. **Structural Implications**:
- Regions with ipTM > 0.6 (red in b1) align with interfaces having solvation energy > -5 kcal/mol (red in b2).
- Green-marked residues in b2 suggest critical interaction sites in stable interfaces.
3. **Outliers**:
- Single low ipTM score (~0.2) in cross-species complexes (a1) may indicate unstable or misfolded regions.
- Divergent solvation energies in cross-species complexes (a2) suggest variable interface stability.
---
### Interpretation
The data demonstrates that **ipTM score and interface solvation energy are complementary metrics for assessing protein complex stability**:
- **ipTM Score**: Reflects overall structural quality, with higher scores indicating better folding.
- **Interface Solvation Energy**: Quantifies interfacial hydrophobicity; less negative values (closer to 0) suggest stronger hydrophobic interactions.
**Biological Insight**:
- D. mel. complexes (red) exhibit optimized interfaces (high ipTM, less negative solvation energy), likely due to co-evolution.
- Cross-species complexes (black) show heterogeneous stability, possibly due to mismatched evolutionary pressures.
- Green-marked residues in b2 (e.g., "D123") may be conserved for maintaining interface integrity.
**Limitations**:
- The single outlier in a1 (ipTM ~0.2) warrants further investigation for potential artifacts or unique structural features.
- The absence of M. mus. in a2 suggests category-specific filtering or data availability constraints.