## Ridge Plots: F1 Score Across Weights
### Overview
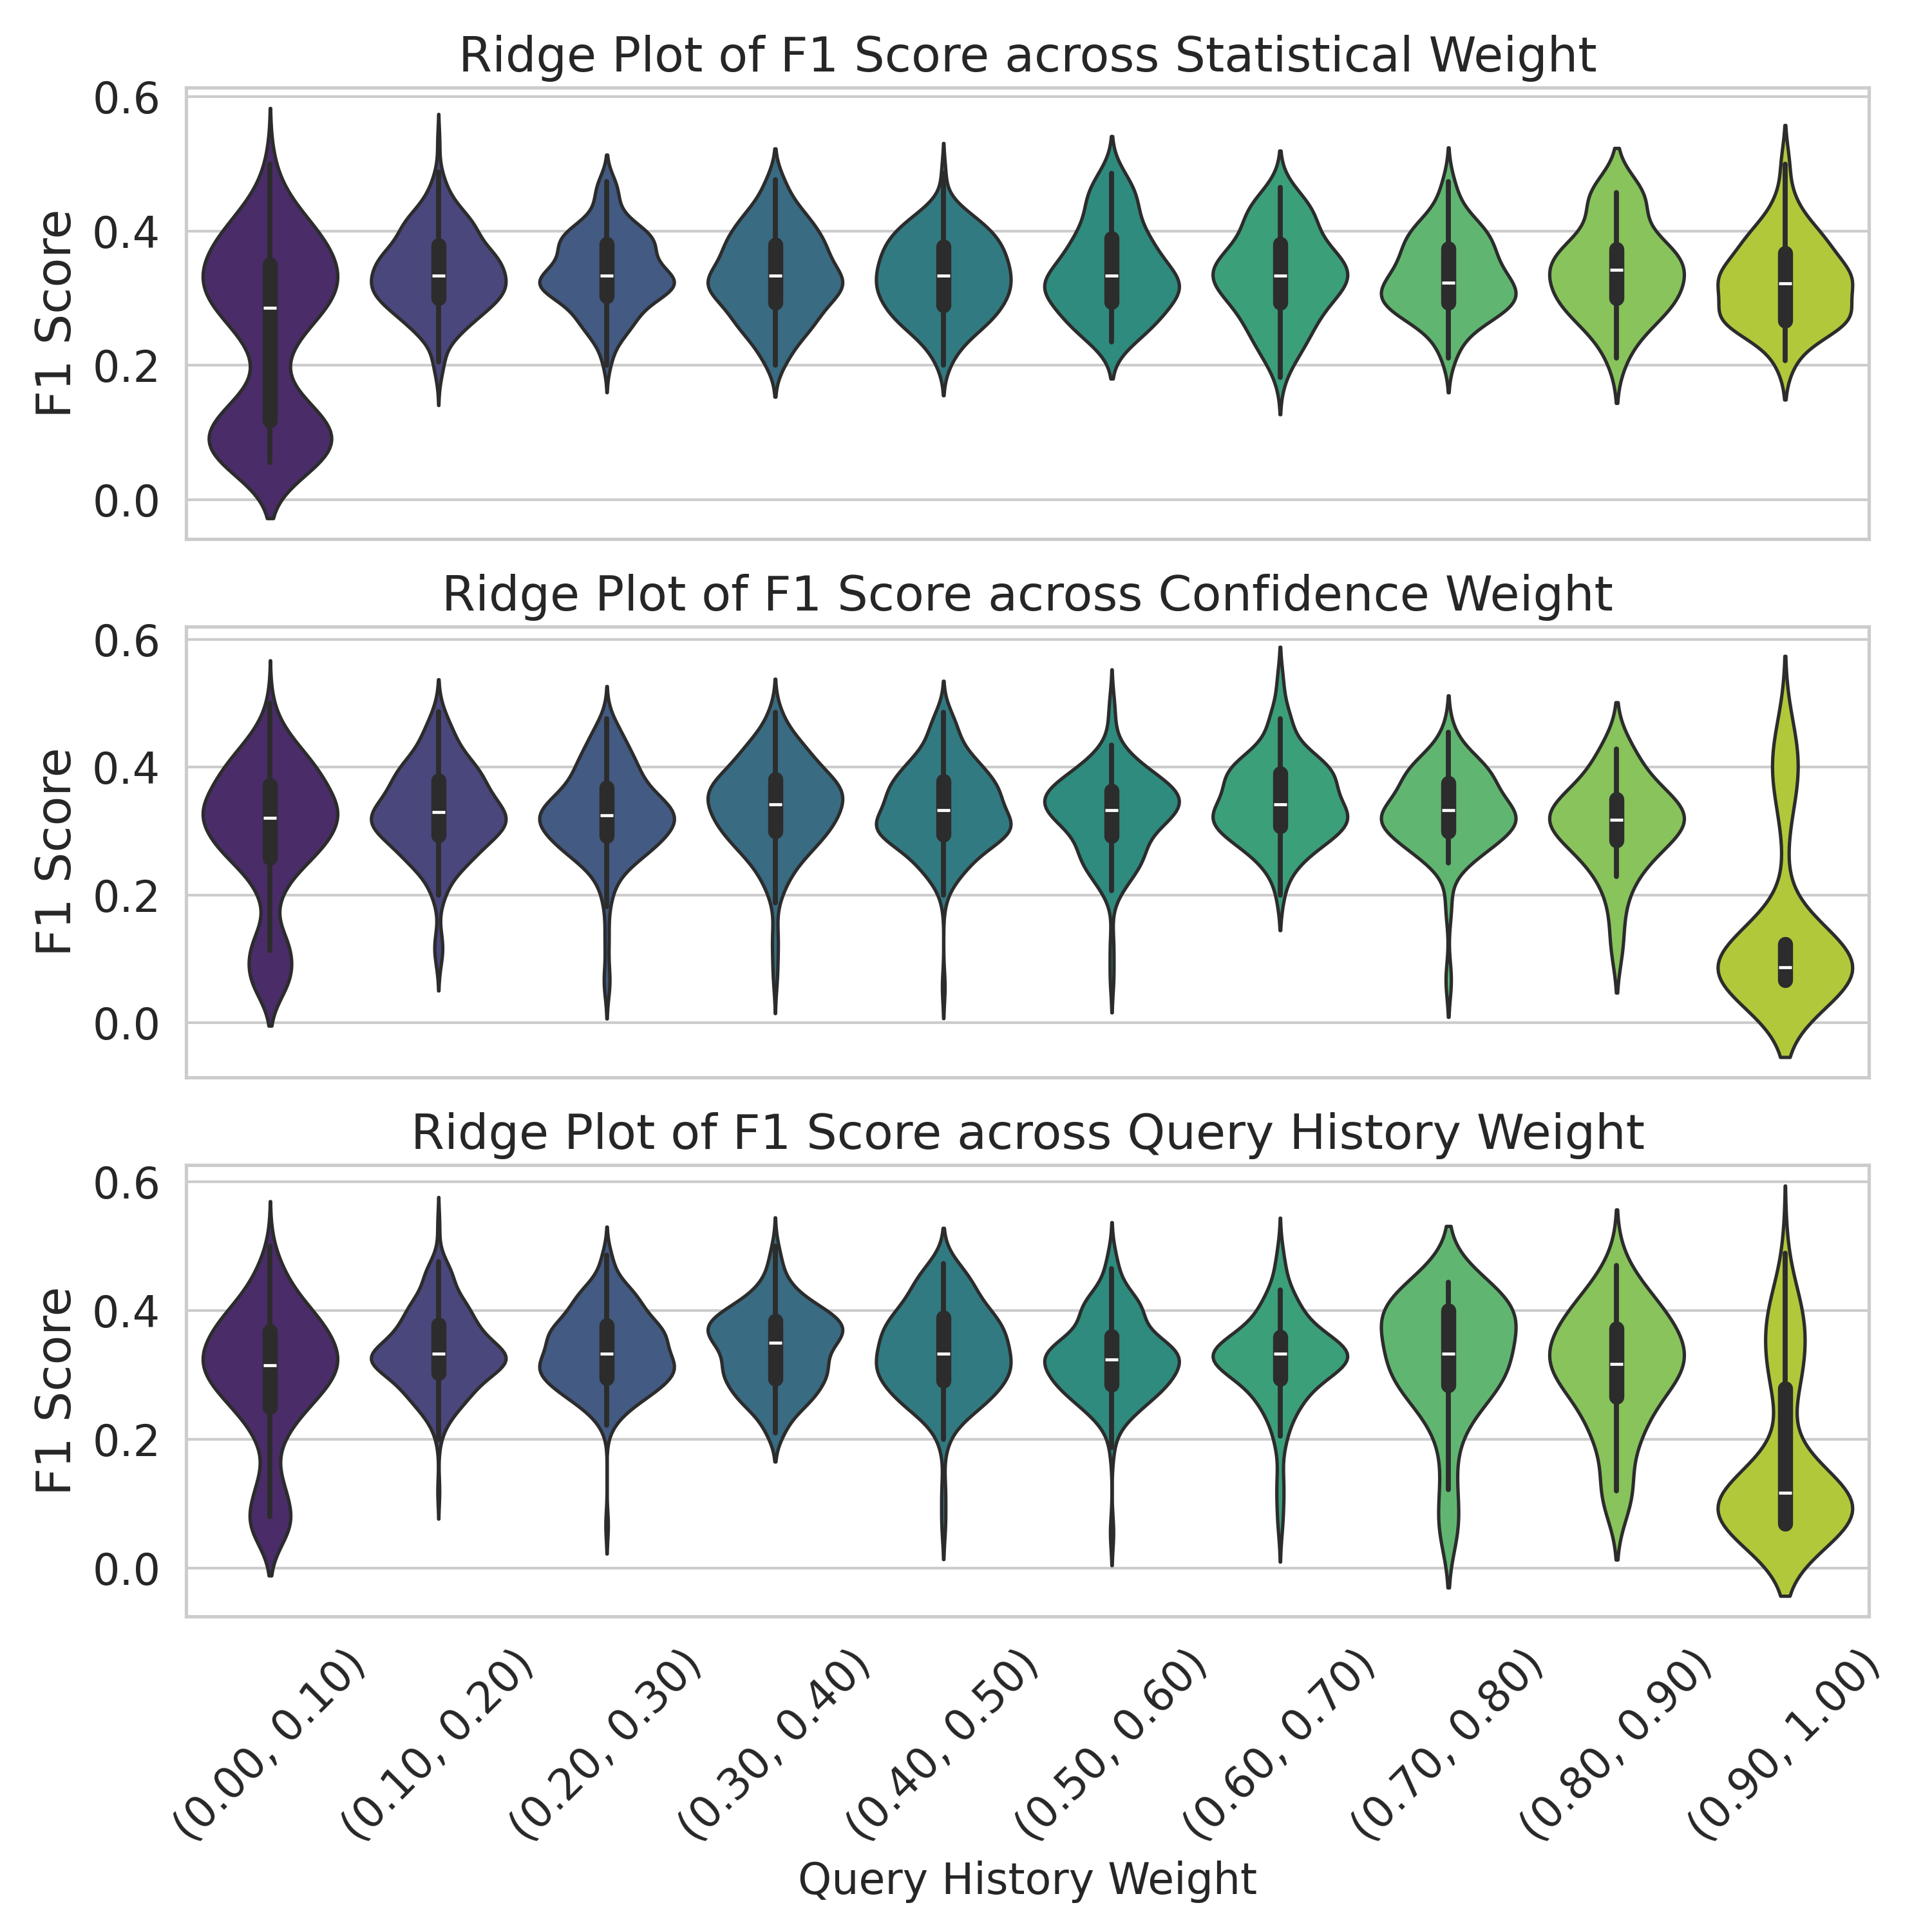
The image presents three ridge plots, each visualizing the distribution of F1 scores across a range of weights. The top plot shows F1 scores against Statistical Weight, the middle plot against Confidence Weight, and the bottom plot against Query History Weight. Each plot displays the F1 score distribution for weights ranging from 0.00 to 1.00, incrementing in steps of 0.10. The plots are stacked vertically, with each weight range represented by a violin plot.
### Components/Axes
* **Title (Top):** "Ridge Plot of F1 Score across Statistical Weight"
* **Title (Middle):** "Ridge Plot of F1 Score across Confidence Weight"
* **Title (Bottom):** "Ridge Plot of F1 Score across Query History Weight"
* **Y-axis Label (All Plots):** "F1 Score" (ranging from 0.0 to 0.6)
* **X-axis Label (Bottom Plot):** "Query History Weight"
* **X-axis Ticks (All Plots):** (0.00, 0.10), (0.10, 0.20), (0.20, 0.30), (0.30, 0.40), (0.40, 0.50), (0.50, 0.60), (0.60, 0.70), (0.70, 0.80), (0.80, 0.90), (0.90, 1.00)
* **Color Gradient (Top):** Dark Purple to Light Purple
* **Color Gradient (Middle):** Dark Blue to Light Blue
* **Color Gradient (Bottom):** Dark Green to Light Green
### Detailed Analysis
**Statistical Weight (Top Plot):**
The F1 score distributions appear relatively consistent across all Statistical Weight values. The violin plots are similar in shape and width, indicating a stable F1 score regardless of the Statistical Weight. The median F1 score appears to hover around 0.35-0.40. There is a slight increase in the spread of the distribution towards the rightmost weights (0.80-1.00).
* (0.00, 0.10): Median ≈ 0.37, Range ≈ 0.15-0.55
* (0.10, 0.20): Median ≈ 0.38, Range ≈ 0.18-0.55
* (0.20, 0.30): Median ≈ 0.37, Range ≈ 0.17-0.54
* (0.30, 0.40): Median ≈ 0.38, Range ≈ 0.18-0.55
* (0.40, 0.50): Median ≈ 0.38, Range ≈ 0.17-0.54
* (0.50, 0.60): Median ≈ 0.38, Range ≈ 0.18-0.55
* (0.60, 0.70): Median ≈ 0.38, Range ≈ 0.17-0.54
* (0.70, 0.80): Median ≈ 0.39, Range ≈ 0.18-0.55
* (0.80, 0.90): Median ≈ 0.39, Range ≈ 0.17-0.54
* (0.90, 1.00): Median ≈ 0.39, Range ≈ 0.18-0.55
**Confidence Weight (Middle Plot):**
Similar to the Statistical Weight plot, the F1 score distributions are largely consistent across Confidence Weight values. The median F1 score remains around 0.35-0.40. There is a slight increase in the spread of the distribution towards the rightmost weights (0.80-1.00).
* (0.00, 0.10): Median ≈ 0.37, Range ≈ 0.15-0.55
* (0.10, 0.20): Median ≈ 0.38, Range ≈ 0.18-0.55
* (0.20, 0.30): Median ≈ 0.37, Range ≈ 0.17-0.54
* (0.30, 0.40): Median ≈ 0.38, Range ≈ 0.18-0.55
* (0.40, 0.50): Median ≈ 0.38, Range ≈ 0.17-0.54
* (0.50, 0.60): Median ≈ 0.38, Range ≈ 0.18-0.55
* (0.60, 0.70): Median ≈ 0.38, Range ≈ 0.17-0.54
* (0.70, 0.80): Median ≈ 0.39, Range ≈ 0.18-0.55
* (0.80, 0.90): Median ≈ 0.39, Range ≈ 0.17-0.54
* (0.90, 1.00): Median ≈ 0.40, Range ≈ 0.18-0.55
**Query History Weight (Bottom Plot):**
This plot shows a more noticeable trend. As the Query History Weight increases, the median F1 score appears to increase slightly. The distributions also become wider towards the higher weight values, suggesting greater variability in F1 scores.
* (0.00, 0.10): Median ≈ 0.35, Range ≈ 0.15-0.50
* (0.10, 0.20): Median ≈ 0.36, Range ≈ 0.16-0.52
* (0.20, 0.30): Median ≈ 0.37, Range ≈ 0.17-0.53
* (0.30, 0.40): Median ≈ 0.38, Range ≈ 0.18-0.54
* (0.40, 0.50): Median ≈ 0.39, Range ≈ 0.19-0.55
* (0.50, 0.60): Median ≈ 0.40, Range ≈ 0.20-0.56
* (0.60, 0.70): Median ≈ 0.41, Range ≈ 0.21-0.57
* (0.70, 0.80): Median ≈ 0.42, Range ≈ 0.22-0.58
* (0.80, 0.90): Median ≈ 0.43, Range ≈ 0.23-0.59
* (0.90, 1.00): Median ≈ 0.45, Range ≈ 0.25-0.60
### Key Observations
* Statistical Weight and Confidence Weight show minimal impact on F1 score distributions.
* Query History Weight exhibits a positive correlation with F1 score, with higher weights generally leading to slightly higher F1 scores and increased variability.
* The F1 scores are generally concentrated between 0.15 and 0.55 across all weight values.
### Interpretation
The ridge plots suggest that the model's performance (as measured by F1 score) is relatively insensitive to changes in Statistical Weight and Confidence Weight. However, incorporating Query History information, even with varying degrees of weight, appears to have a positive, albeit modest, impact on the F1 score. The increasing variability in F1 scores with higher Query History Weight could indicate that the model benefits from considering past queries, but the optimal weighting may depend on the specific dataset or task. The consistent F1 score range suggests that the model has a baseline level of performance, and the weights primarily influence the distribution of scores rather than drastically altering the overall performance. Further investigation might involve exploring different weighting schemes or combining Query History Weight with other features to maximize F1 score.