TECHNICAL ASSET FINGERPRINT
ca0cdc09ec46d07cf37b3d57
Click to view fullscreen
Press ESC or click to close
FOUND IN PAPERS
EXPERT: healer-alpha-free VERSION 1
RUNTIME: free/openrouter/healer-alpha
INTEL_VERIFIED
## Ridge Plot of F1 Score across Three Weight Categories
### Overview
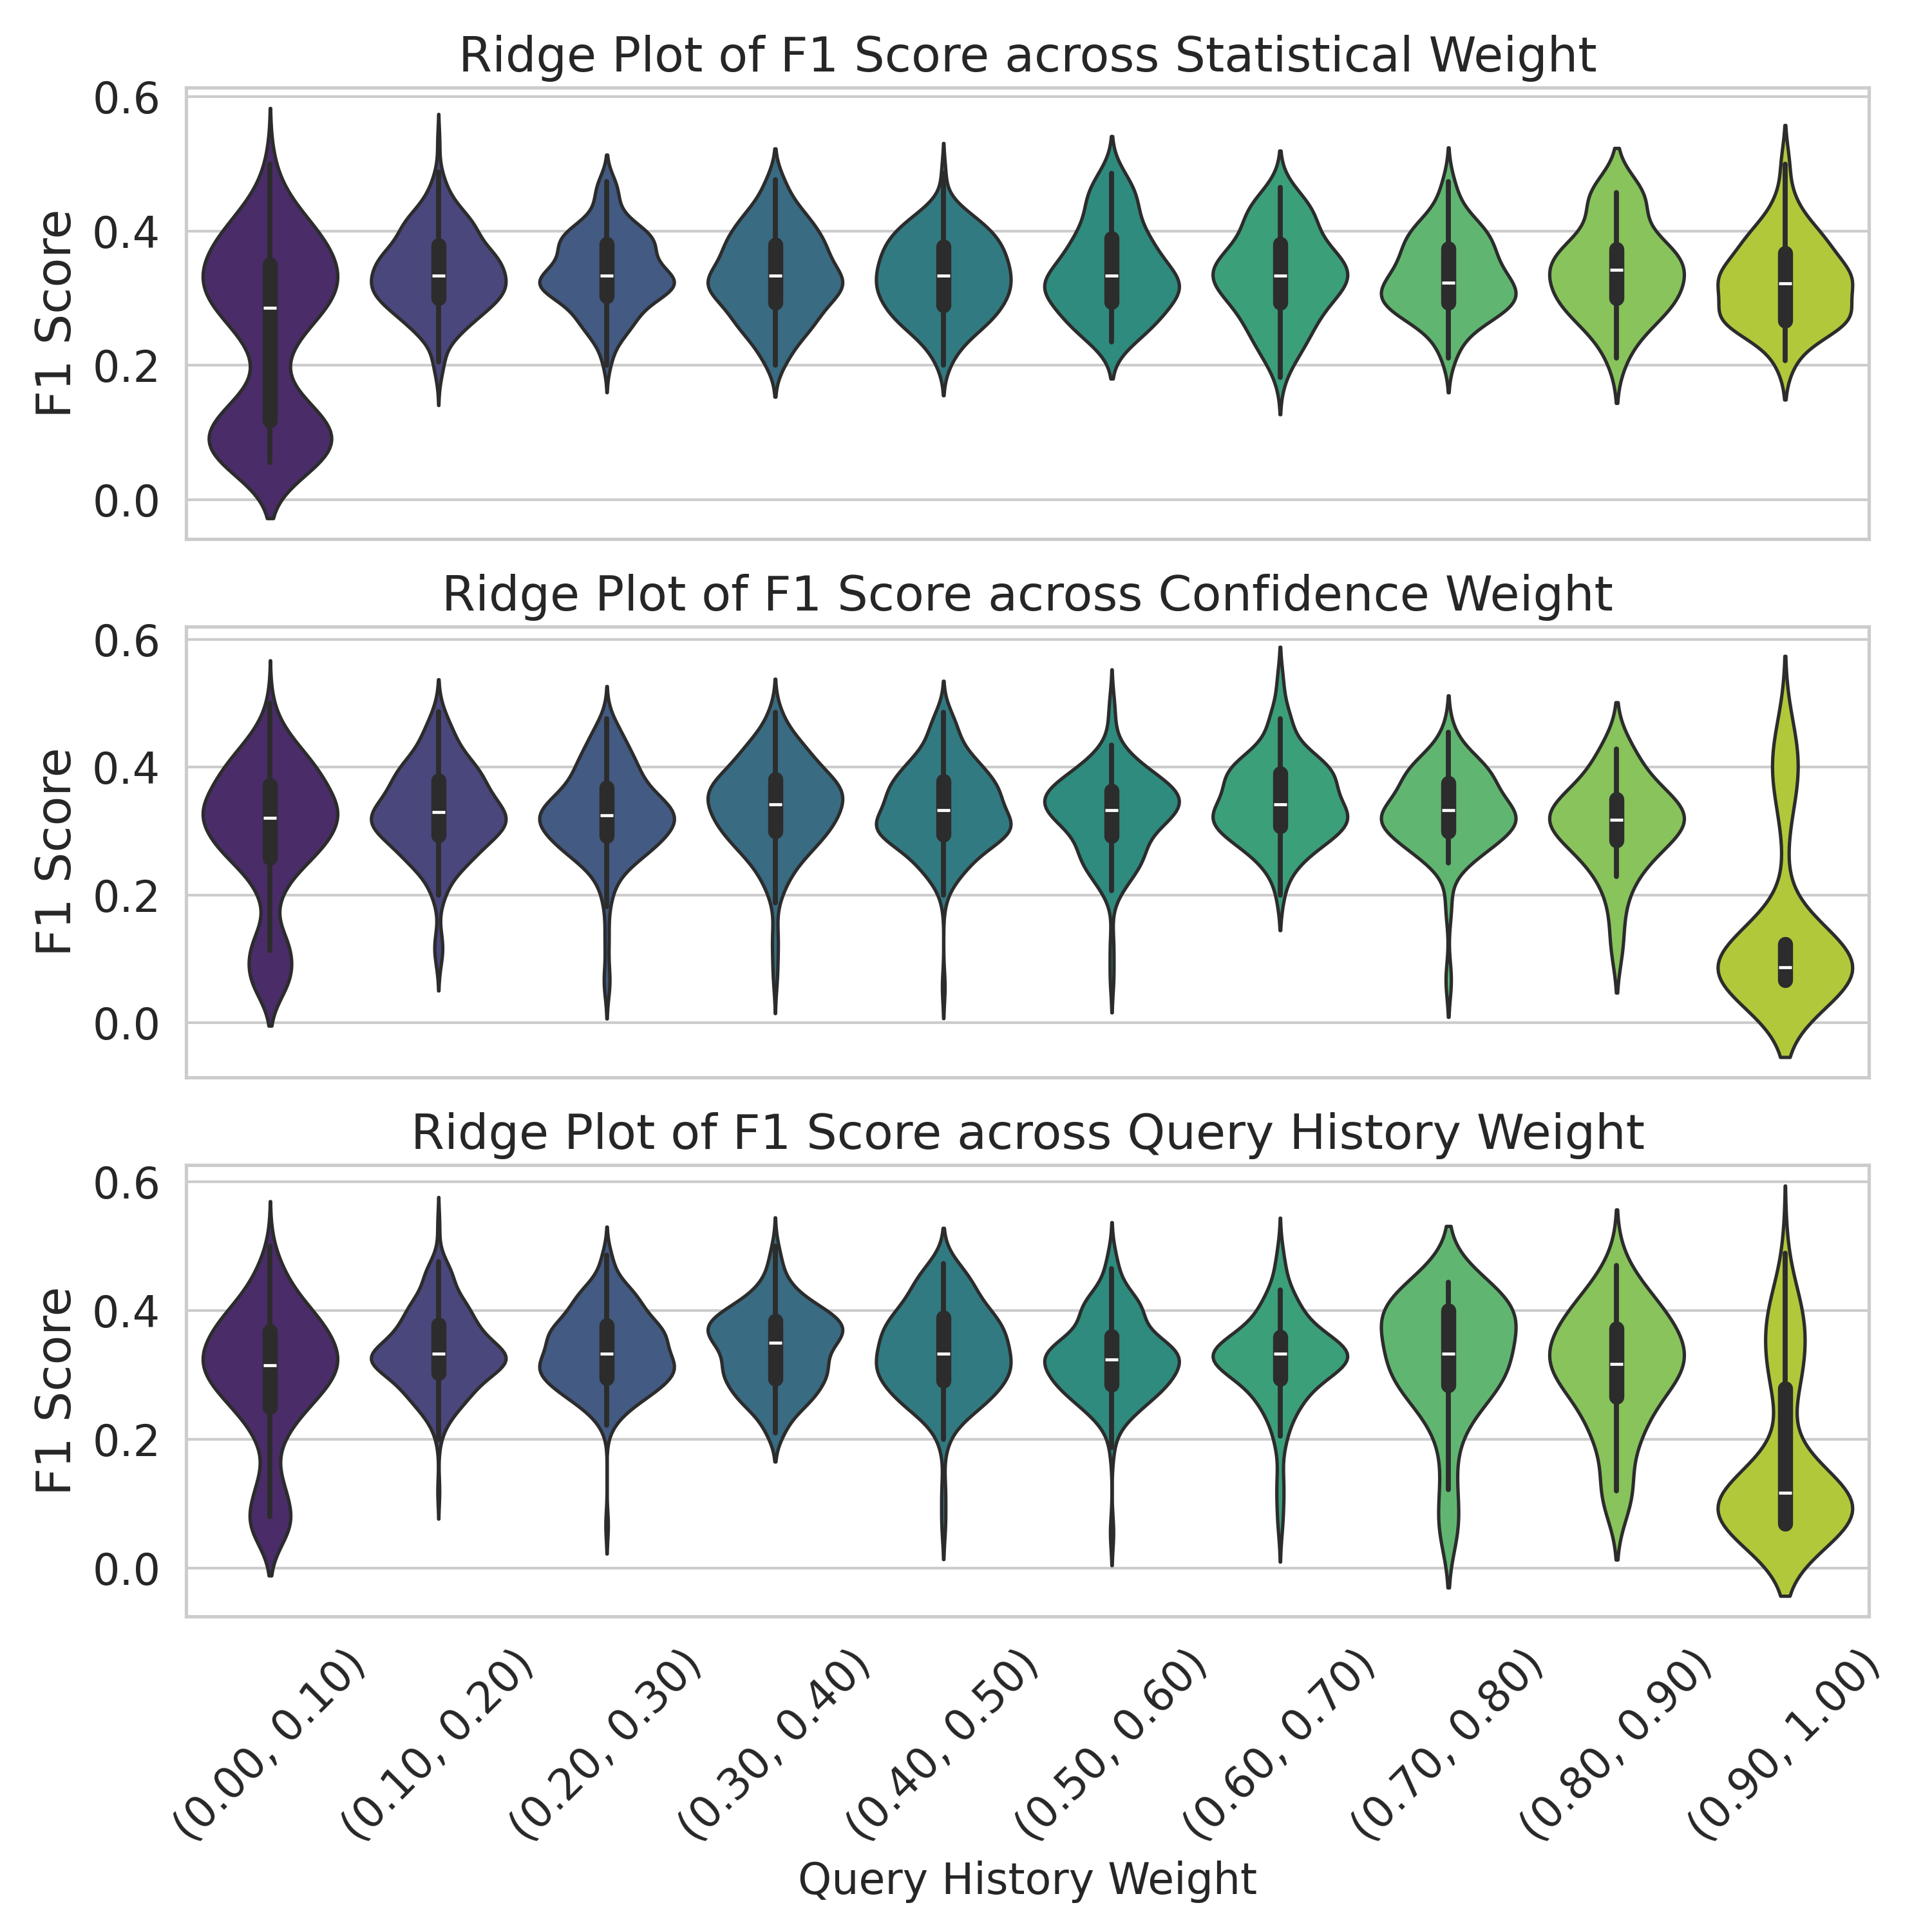
The image displays three vertically stacked ridge plots (also known as violin plots) that visualize the distribution of F1 scores for a model or system across different ranges of three distinct weighting parameters: Statistical Weight, Confidence Weight, and Query History Weight. Each plot shares the same y-axis (F1 Score) and x-axis (weight bins), allowing for direct comparison of how performance distributions shift as each weight parameter increases.
### Components/Axes
* **Chart Type:** Ridge Plot / Violin Plot (showing probability density of the data).
* **Y-Axis (All Plots):** Labeled "F1 Score". Scale ranges from 0.0 to 0.6, with major gridlines at 0.0, 0.2, 0.4, and 0.6.
* **X-Axis (Bottom Plot Only):** Labeled "Query History Weight". Contains ten categorical bins representing ranges of the weight parameter:
* (0.00, 0.10), (0.10, 0.20), (0.20, 0.30), (0.30, 0.40), (0.40, 0.50), (0.50, 0.60), (0.60, 0.70), (0.70, 0.80), (0.80, 0.90), (0.90, 1.00)
* **Plot Titles (Top to Bottom):**
1. "Ridge Plot of F1 Score across Statistical Weight"
2. "Ridge Plot of F1 Score across Confidence Weight"
3. "Ridge Plot of F1 Score across Query History Weight"
* **Visual Encoding:** Each bin on the x-axis has a corresponding "violin" shape. The width of the violin at a given y-value represents the density of data points (F1 scores) at that value. Inside each violin is a miniature box plot: the white dot is the median, the thick black bar represents the interquartile range (IQR), and the thin black line represents the rest of the distribution, excluding outliers.
* **Color:** The violins are colored with a sequential gradient from dark purple (leftmost bin, low weight) to light yellow-green (rightmost bin, high weight). This color progression is consistent across all three plots and visually reinforces the increasing weight value.
### Detailed Analysis
**1. Ridge Plot of F1 Score across Statistical Weight (Top Plot)**
* **Trend:** The distributions are relatively stable and symmetric across most weight bins. The median F1 score hovers consistently between approximately 0.30 and 0.40.
* **Data Points (Approximate Medians & Ranges):**
* Bins (0.00, 0.10) to (0.80, 0.90): Medians are tightly clustered around 0.35. The bulk of the data (IQR) for each bin lies roughly between 0.25 and 0.45. The full range extends from near 0.0 to about 0.55-0.60.
* Bin (0.90, 1.00): Shows a very similar distribution to the others, with a median near 0.35.
* **Shape:** Violins are generally "fat" in the middle (around the median) and taper symmetrically, indicating a unimodal distribution of F1 scores for each weight range.
**2. Ridge Plot of F1 Score across Confidence Weight (Middle Plot)**
* **Trend:** Distributions are stable for the first nine bins, similar to the Statistical Weight plot. However, there is a dramatic and anomalous change in the final bin.
* **Data Points (Approximate Medians & Ranges):**
* Bins (0.00, 0.10) to (0.80, 0.90): Medians are stable around 0.35-0.38. IQRs are roughly 0.28 to 0.45. Ranges extend from 0.0 to ~0.55.
* **Bin (0.90, 1.00) - OUTLIER:** The distribution collapses. The median drops sharply to approximately 0.10. The violin is very narrow and concentrated at the low end, with the IQR between ~0.05 and ~0.15. The range is much smaller, from ~0.0 to ~0.20. This indicates a severe performance degradation when Confidence Weight is very high.
**3. Ridge Plot of F1 Score across Query History Weight (Bottom Plot)**
* **Trend:** Shows more variability in distribution shape across bins compared to the other two plots. There is a slight downward trend in median F1 score as weight increases, with a notable drop in the final bin.
* **Data Points (Approximate Medians & Ranges):**
* Bin (0.00, 0.10): Median ~0.35. Distribution is broad.
* Bins (0.10, 0.20) to (0.70, 0.80): Medians fluctuate between ~0.30 and ~0.38. Some distributions (e.g., (0.50, 0.60)) appear more bimodal or have longer tails.
* Bin (0.80, 0.90): Median ~0.32.
* Bin (0.90, 1.00): Median drops to ~0.20. The distribution is skewed lower, with a significant density below 0.20, though not as extreme as the Confidence Weight outlier.
### Key Observations
1. **Color-Coded Progression:** The consistent purple-to-green gradient across all plots effectively encodes the increasing weight value on the x-axis.
2. **Stability in Statistical Weight:** Performance (F1 score) is remarkably robust to changes in Statistical Weight across its entire range.
3. **Critical Threshold in Confidence Weight:** There is a clear performance cliff when Confidence Weight enters the (0.90, 1.00) range. This is the most significant anomaly in the dataset.
4. **Moderate Sensitivity in Query History Weight:** Performance shows a gentle decline and increased variance as Query History Weight increases, with a more pronounced drop at the highest range.
5. **Common Performance Range:** For most weight configurations (excluding the outliers), the model's F1 score typically centers around 0.35, with the majority of results falling between 0.20 and 0.50.
### Interpretation
This analysis suggests how different components of a model's weighting scheme affect its overall accuracy (F1 score).
* **Statistical Weight** appears to be a well-calibrated parameter; adjusting it within the tested range does not harm performance, indicating the model's statistical foundations are stable.
* **Confidence Weight** is a high-risk, high-reward parameter. While moderate values maintain good performance, setting it too high (>0.90) catastrophically undermines the model's effectiveness. This could imply that over-reliance on the model's own confidence scores leads to poor decision-making, perhaps due to overconfidence on difficult examples.
* **Query History Weight** has a more nuanced impact. Its negative effect at high values suggests that over-weighting past queries might introduce noise or bias, reducing adaptability to new information. The increased variance in the middle ranges indicates this parameter's effect is less predictable.
**In summary:** To maximize and stabilize F1 score, the Statistical Weight can be set freely, the Confidence Weight should be kept below 0.90, and the Query History Weight should likely be kept in the low-to-mid range (e.g., 0.00-0.60). The dramatic failure mode at high Confidence Weight is the most critical finding for system tuning.
DECODING INTELLIGENCE...