## Violin Plots: F1 Score Distribution Across Weight Parameters
### Overview
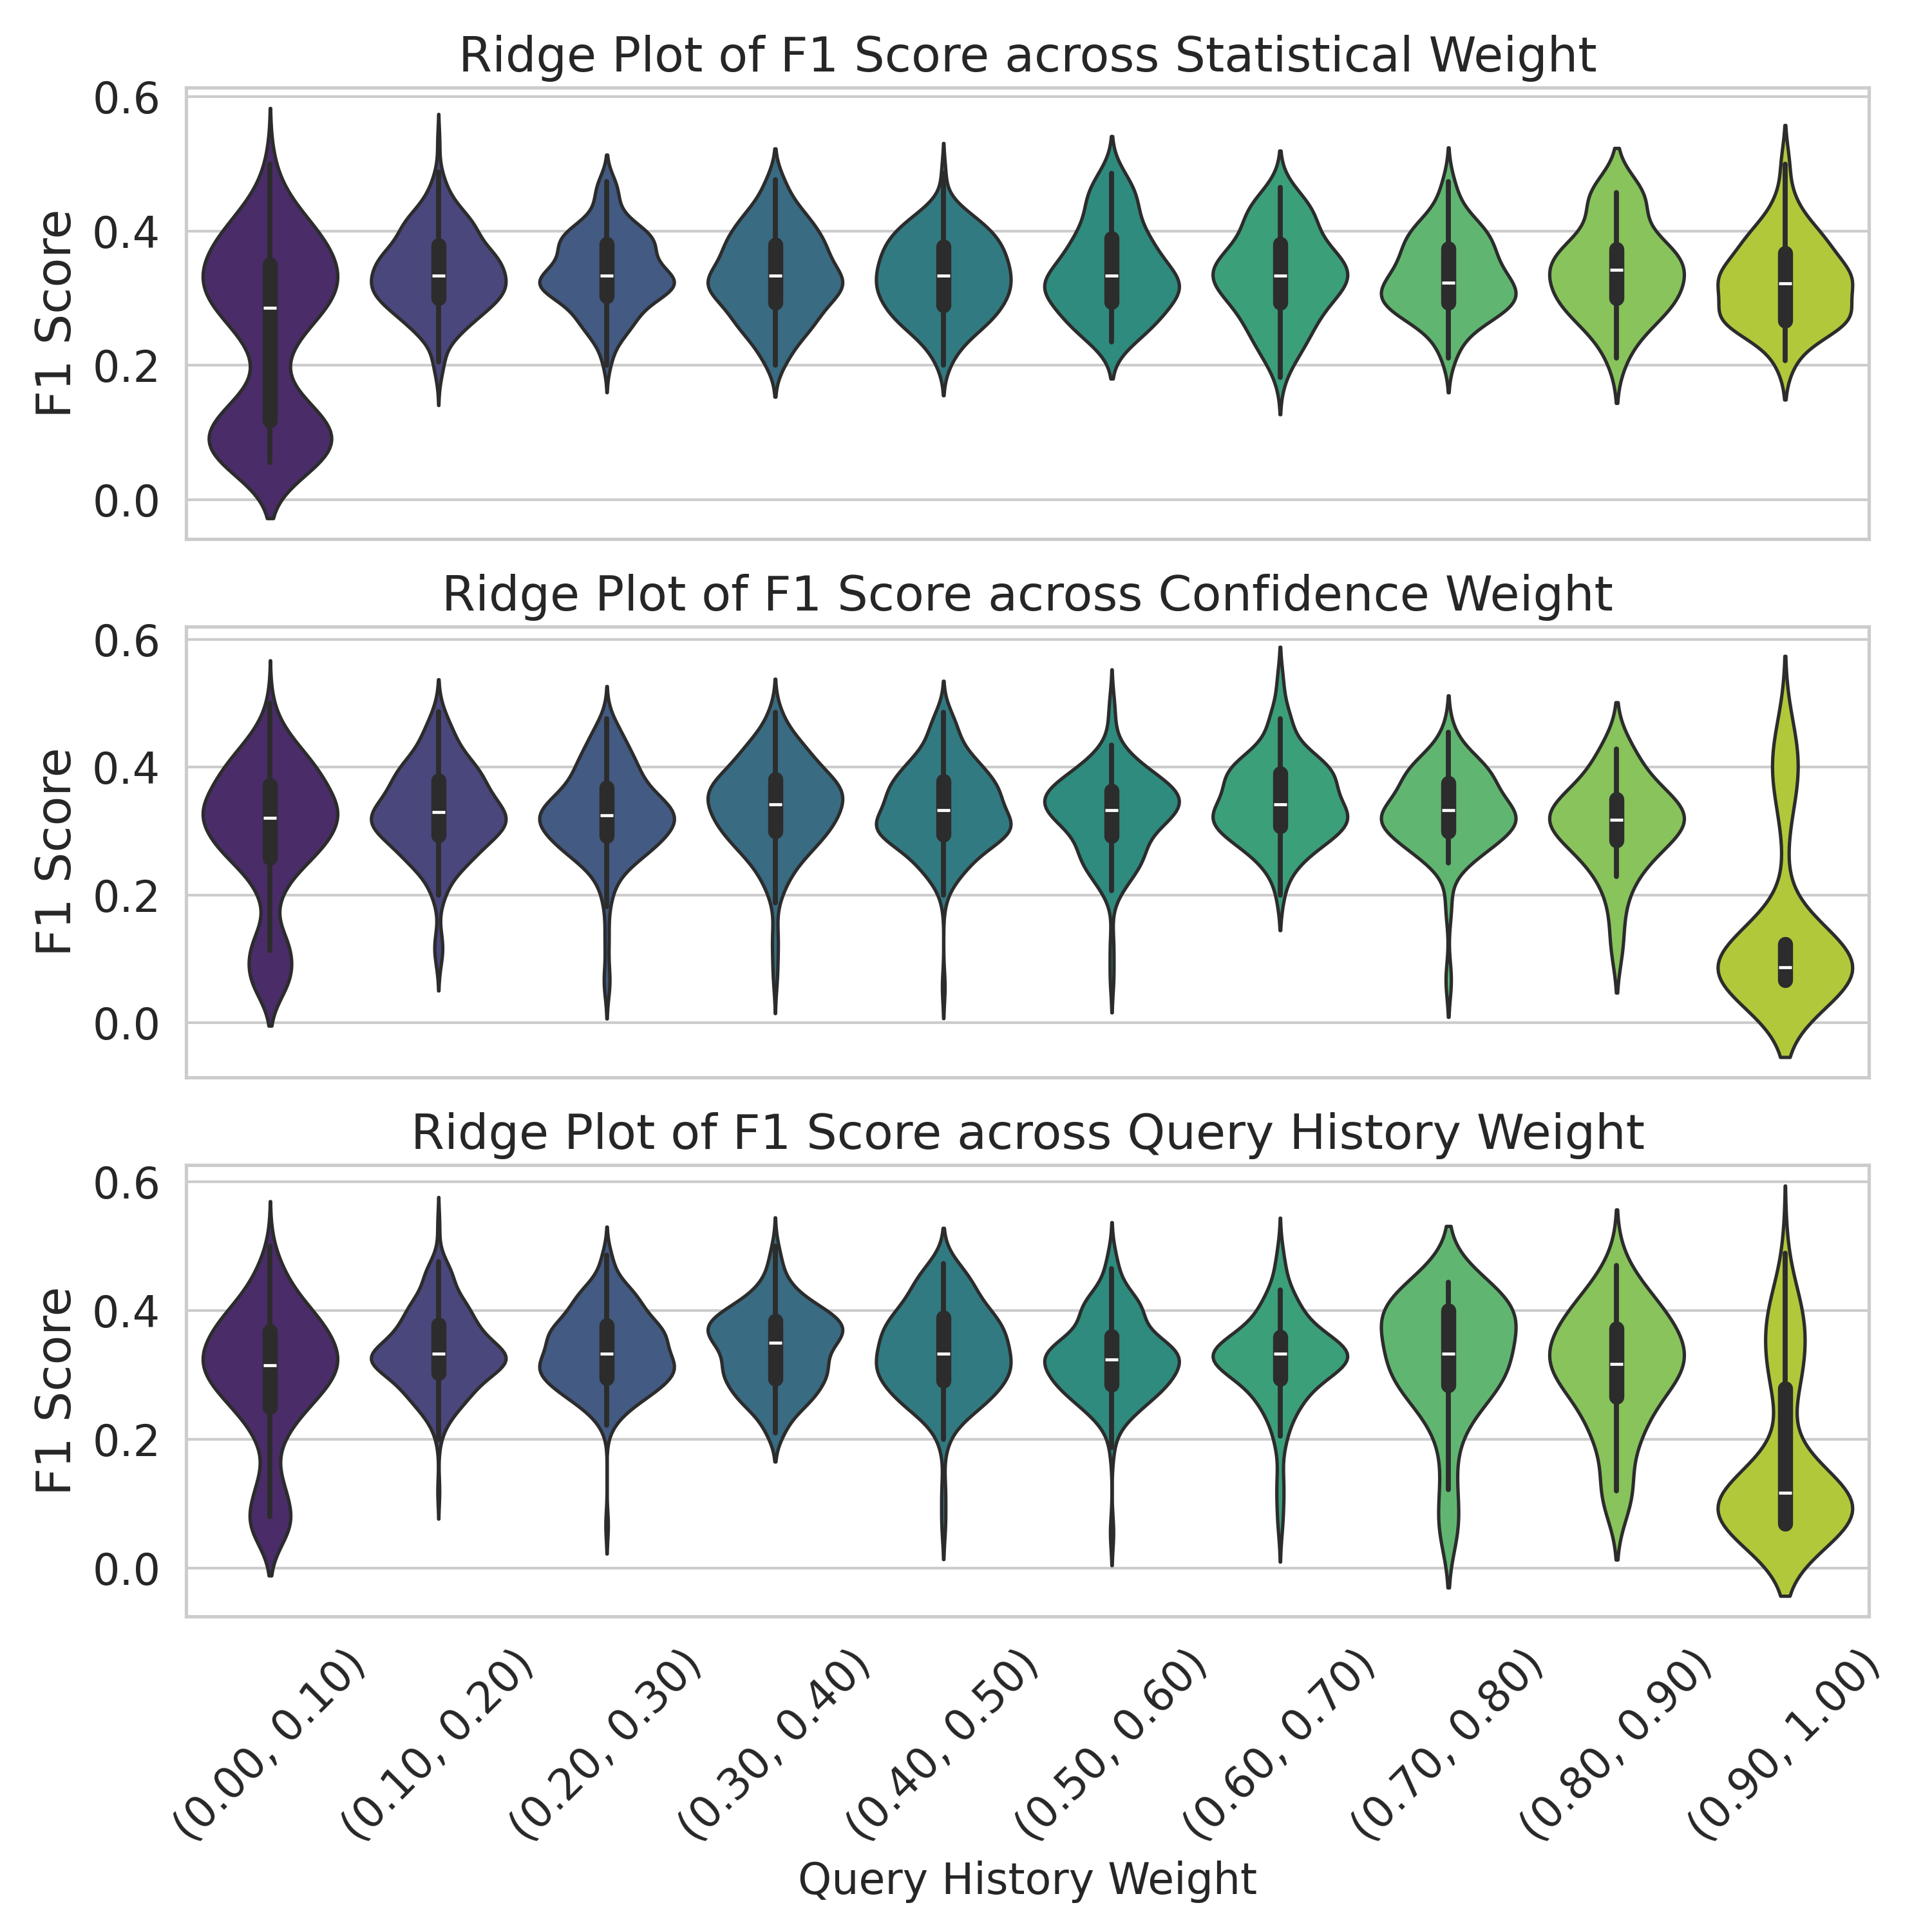
The image contains three horizontally aligned ridge plots comparing F1 score distributions across different weight parameters. Each plot uses a color gradient from purple (low values) to yellow (high values) to represent weight ranges. The y-axis consistently shows F1 scores from 0.0 to 0.6 across all plots.
### Components/Axes
1. **Y-Axis**:
- Label: "F1 Score"
- Scale: 0.0 to 0.6 in 0.1 increments
- Position: Left side of all plots
2. **X-Axes**:
- **Top Plot**: "Statistical Weight" with ranges (0.00, 0.10) to (0.90, 1.00)
- **Middle Plot**: "Confidence Weight" with identical range structure
- **Bottom Plot**: "Query History Weight" with same range intervals
- Color Gradient: Purple (low weights) → Green (mid weights) → Yellow (high weights)
3. **Violin Plot Structure**:
- Each plot contains 10 weight intervals
- Black median lines with white interquartile markers
- Transparent fill showing distribution density
### Detailed Analysis
**Statistical Weight Plot**:
- Highest density at (0.30, 0.40) with F1 scores peaking at ~0.45
- Significant drop in performance at extreme weights (<0.10 and >0.80)
- Distribution width suggests moderate variability in model performance
**Confidence Weight Plot**:
- Optimal performance at (0.50, 0.60) with F1 scores reaching ~0.50
- Narrower distribution than statistical weight plot
- Clear bimodal pattern with secondary peak at (0.20, 0.30)
**Query History Weight Plot**:
- Strongest performance at (0.70, 0.80) with F1 scores up to ~0.55
- Most concentrated distribution among the three
- Sharp decline in performance beyond 0.80 weight
### Key Observations
1. All three weight parameters show optimal performance in mid-range values
2. Query History Weight demonstrates the most focused optimal range
3. Statistical Weight exhibits the greatest performance variability
4. Confidence Weight shows bimodal distribution pattern
5. Color gradient consistently maps weight magnitude across all plots
### Interpretation
The data suggests that model performance is most stable and effective when using moderate weight values across all three parameters. The Query History Weight parameter appears particularly sensitive, with a narrow optimal range and rapid performance decline at higher weights. The bimodal pattern in Confidence Weight indicates potential for two distinct effective configurations. The consistent color coding across plots facilitates cross-comparison, though the absence of an explicit legend requires careful attention to gradient interpretation. These findings imply that careful weight tuning, particularly for Query History, could significantly improve model performance while maintaining stability through balanced parameter selection.