## Line Chart: Learning Rate
### Overview
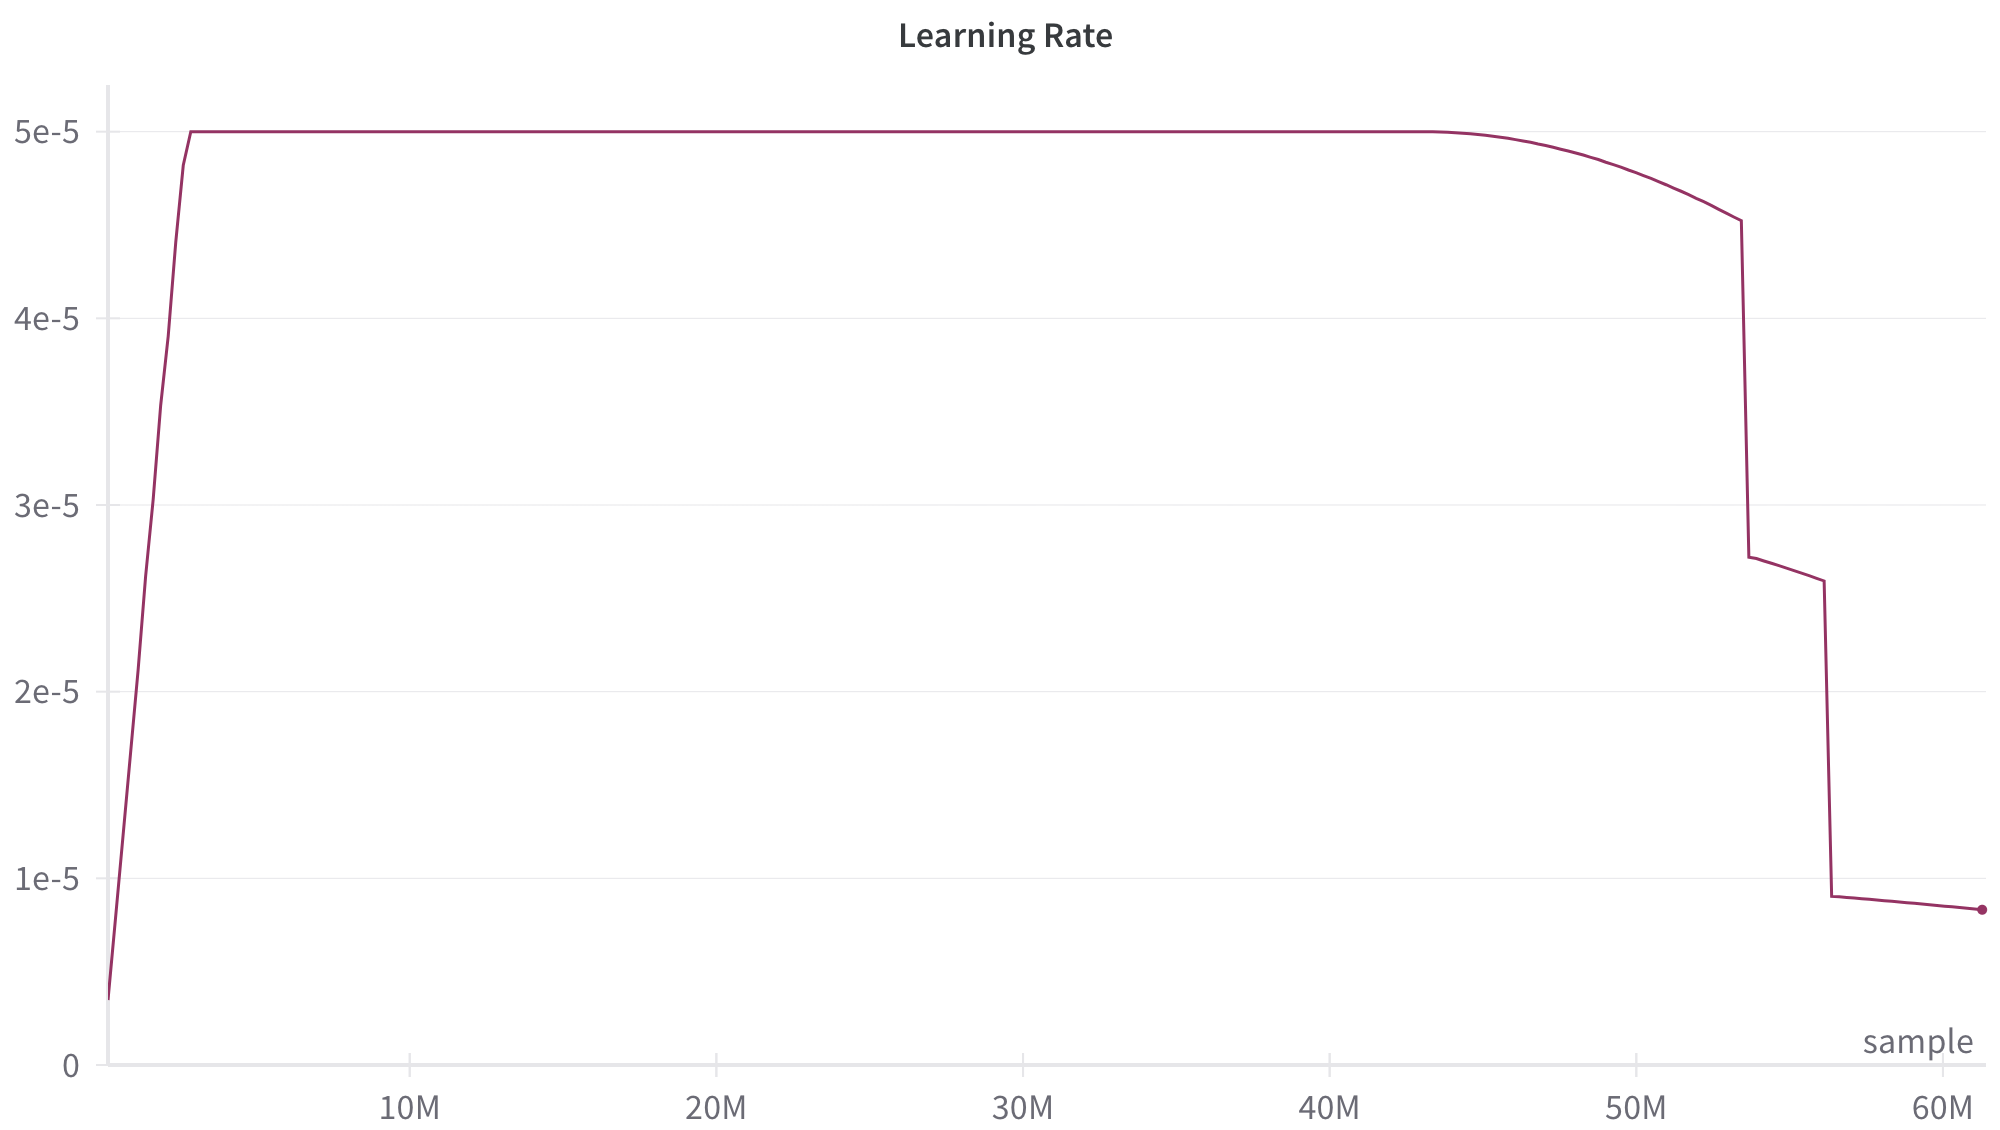
The image is a line chart depicting the learning rate over a number of samples. The x-axis represents the number of samples in millions (M), ranging from 0 to 60M. The y-axis represents the learning rate, ranging from 0 to 5e-5. The line shows the learning rate initially increasing rapidly, then remaining constant for a period, and finally decreasing in steps.
### Components/Axes
* **Title:** Learning Rate
* **X-axis:** sample
* Scale: 0, 10M, 20M, 30M, 40M, 50M, 60M
* **Y-axis:** Learning Rate
* Scale: 0, 1e-5, 2e-5, 3e-5, 4e-5, 5e-5
* **Data Series:**
* A single line in a dark purple color represents the learning rate.
### Detailed Analysis
The learning rate data series exhibits the following behavior:
1. **Initial Increase:** The line starts at approximately 0 at sample 0 and rises sharply to 5e-5 by approximately 2M samples.
2. **Plateau:** The line remains constant at 5e-5 from approximately 2M samples to approximately 45M samples.
3. **Gradual Decrease:** From approximately 45M to 50M samples, the line gradually decreases from 5e-5 to approximately 4.5e-5.
4. **Sharp Drop:** At approximately 50M samples, the line drops sharply to approximately 2.7e-5.
5. **Slight Decrease:** From approximately 50M to 55M samples, the line decreases slightly to approximately 2.6e-5.
6. **Sharp Drop:** At approximately 55M samples, the line drops sharply to approximately 0.9e-5.
7. **Final Plateau:** The line remains relatively constant at approximately 0.9e-5 from approximately 55M samples to 60M samples.
### Key Observations
* The learning rate is initially increased rapidly.
* The learning rate is held constant for a significant portion of the training.
* The learning rate is decreased in steps, with a larger drop occurring around 50M samples and 55M samples.
* The final learning rate is significantly lower than the initial learning rate.
### Interpretation
The chart illustrates a learning rate schedule that is commonly used in machine learning to improve model convergence and performance. The initial high learning rate allows the model to quickly explore the parameter space and find a good starting point. The constant learning rate allows the model to refine its parameters and converge to a local minimum. The decreasing learning rate helps the model to avoid overshooting the optimal solution and to fine-tune its parameters for better generalization. The sharp drops in learning rate at 50M and 55M samples suggest that the model may have encountered plateaus or oscillations in the loss function, and the learning rate was reduced to help it escape these regions.