\n
## Line Chart: Learning Rate
### Overview
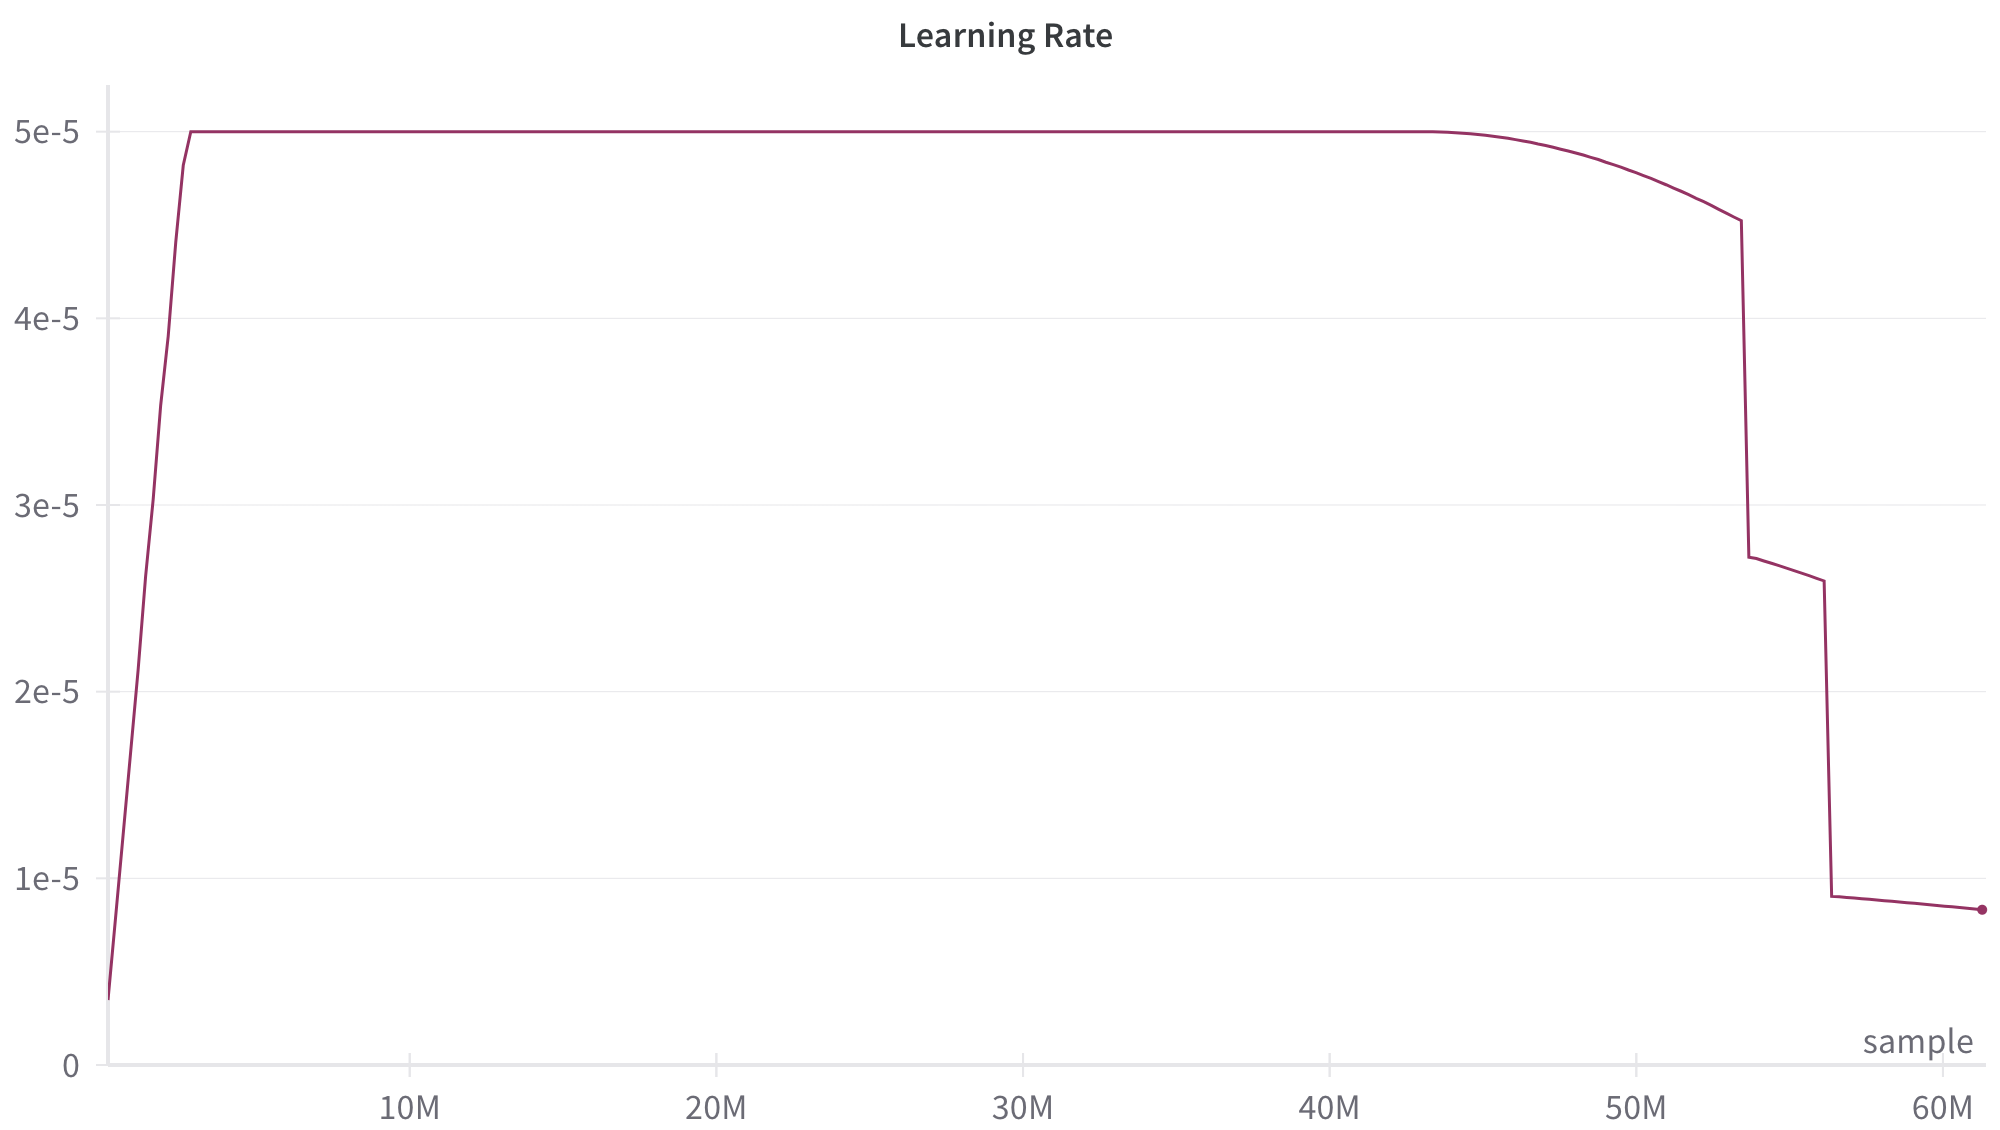
The image presents a line chart illustrating the learning rate over a range of samples, likely during a machine learning training process. The x-axis represents the sample number (in millions), and the y-axis represents the learning rate (in scientific notation). The chart shows a dynamic learning rate schedule, starting high, plateauing, and then decreasing sharply towards the end of the training.
### Components/Axes
* **Title:** "Learning Rate" - positioned at the top-center of the chart.
* **X-axis:** "Sample" - labeled at the bottom, with values in millions (M). The scale ranges from 0M to 60M, with markers at 10M, 20M, 30M, 40M, 50M, and 60M.
* **Y-axis:** "Learning Rate" - labeled on the left side, with values in scientific notation (e.g., 1e-5). The scale ranges from 0 to approximately 5.5e-5, with gridlines indicating increments.
* **Data Series:** A single line in maroon color representing the learning rate.
* **Label:** "sample" - positioned at the bottom-right corner of the chart.
### Detailed Analysis
The maroon line representing the learning rate exhibits the following behavior:
1. **Initial Increase (0M - ~5M):** The learning rate rapidly increases from approximately 0 to a peak of around 5.2e-5.
2. **Plateau (~5M - ~45M):** The learning rate remains relatively constant at approximately 5.0e-5 for a significant portion of the training process, spanning from roughly 5 million to 45 million samples.
3. **Decrease (~45M - ~55M):** The learning rate begins to decrease from approximately 5.0e-5 to around 4.7e-5.
4. **Sharp Drop (~55M - 60M):** The learning rate experiences a dramatic and rapid decline from approximately 4.7e-5 to approximately 1.0e-5 between 55 million and 60 million samples.
Approximate Data Points:
* 0M: 0e-5
* 5M: 5.2e-5
* 10M: 5.0e-5
* 20M: 5.0e-5
* 30M: 5.0e-5
* 40M: 5.0e-5
* 45M: 5.0e-5
* 50M: 4.8e-5
* 55M: 4.7e-5
* 60M: 1.0e-5
### Key Observations
* The learning rate schedule is not constant; it's designed to change over time.
* The initial rapid increase suggests a fast learning phase at the beginning of training.
* The prolonged plateau indicates a period of stable learning.
* The final sharp drop suggests a fine-tuning phase or a mechanism to prevent overfitting.
* The final value is significantly lower than the plateau, indicating a substantial reduction in the learning rate towards the end of training.
### Interpretation
This learning rate schedule is a common technique in machine learning, particularly in optimization algorithms like stochastic gradient descent (SGD) or its variants (Adam, RMSprop). The initial high learning rate allows the model to quickly explore the parameter space and make significant progress. The plateau phase enables stable convergence, while the final drop helps to refine the model and avoid oscillations or overshooting the optimal solution. The sharp decrease at the end is likely a form of learning rate decay, designed to prevent the model from making large adjustments late in training, which could disrupt a well-learned solution. The "sample" label suggests this chart is tracking the learning rate's evolution as the model processes more training data. The data suggests a well-tuned learning rate schedule designed to balance exploration, convergence, and fine-tuning during the training process.