## Line Chart: Learning Rate
### Overview
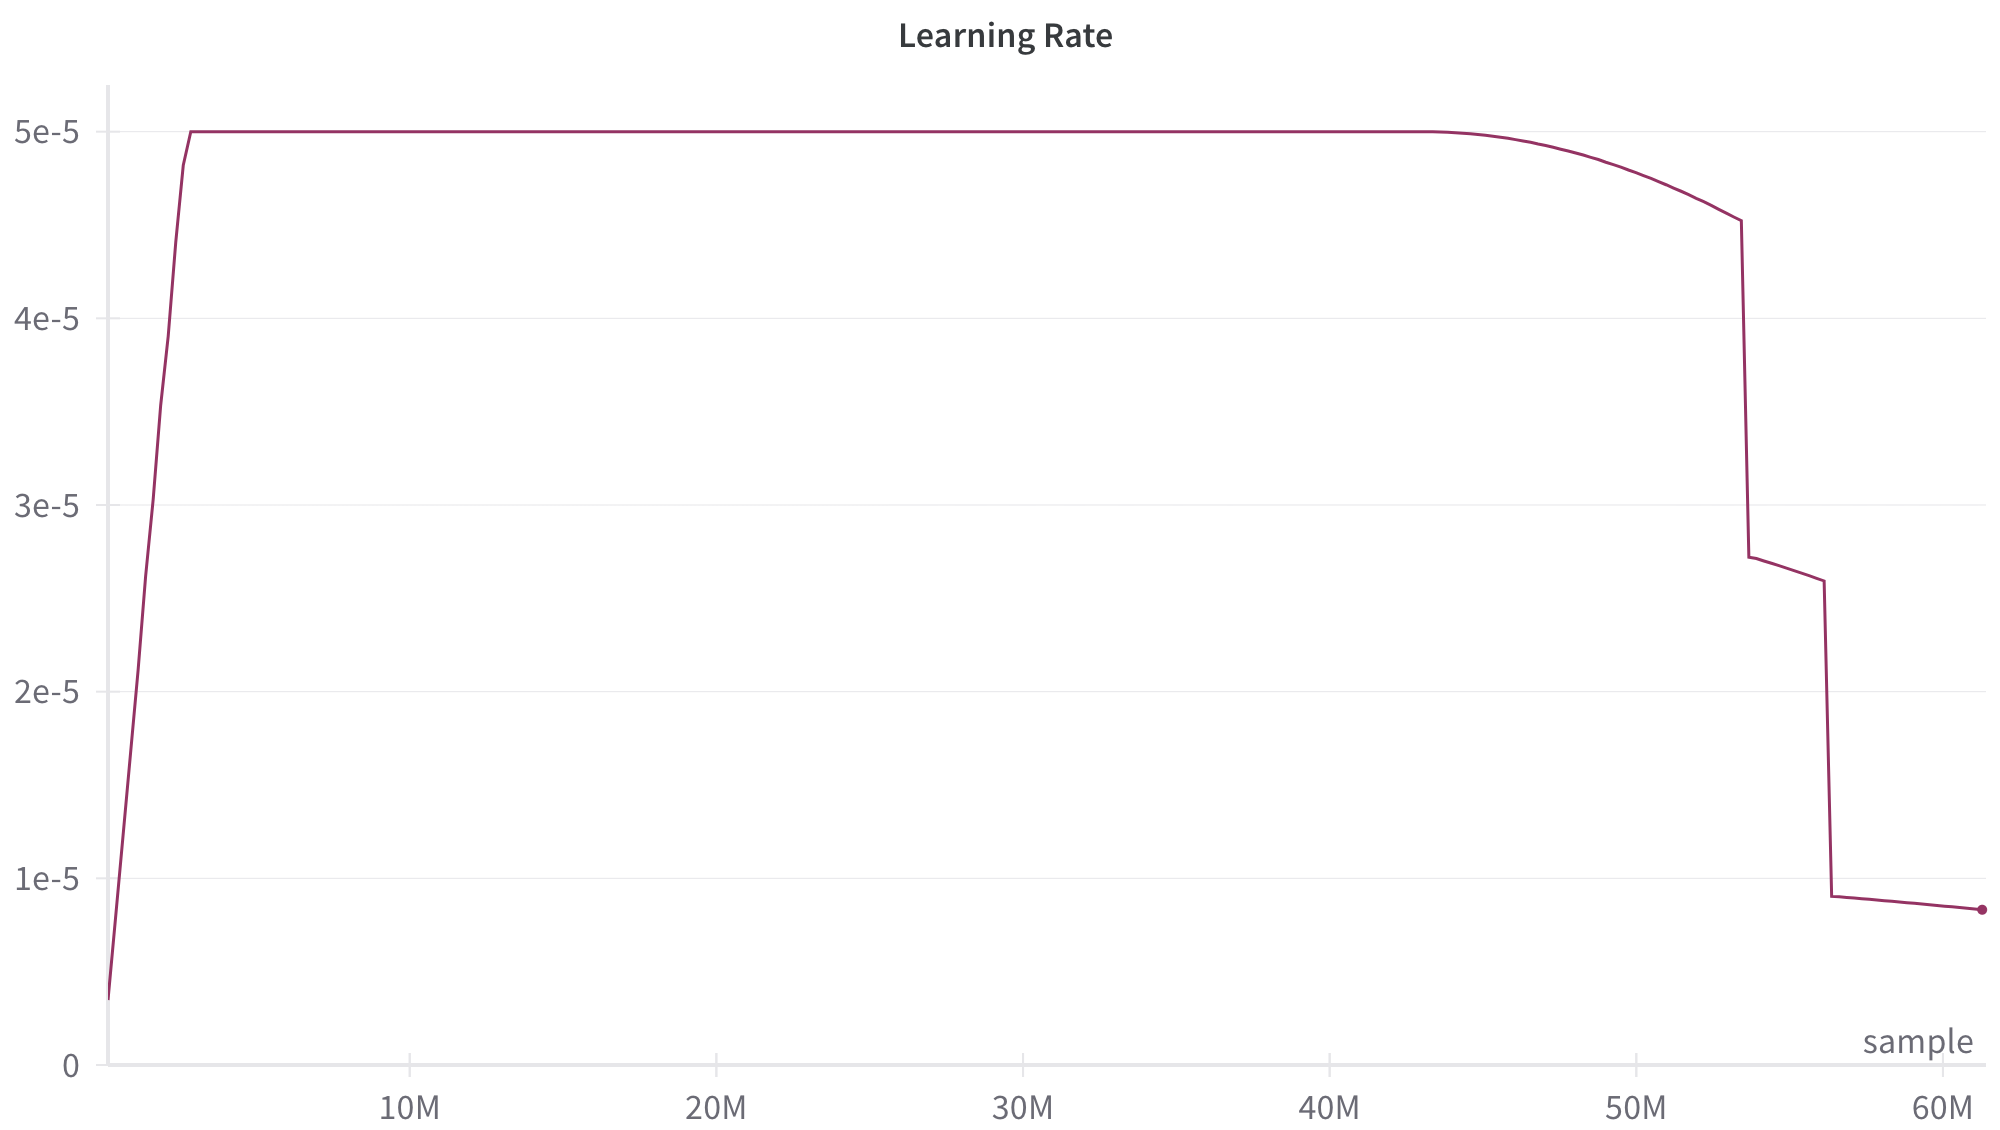
The image depicts a line chart titled "Learning Rate" with a single data series represented by a maroon line. The chart shows a learning rate metric plotted against a sample count (x-axis) ranging from 0 to 60M. The y-axis represents learning rate values in scientific notation (1e-5 to 5e-5). The line exhibits a plateau phase followed by a sharp decline, with a final value near 0.8e-5 at 60M samples.
### Components/Axes
- **Title**: "Learning Rate" (centered at the top)
- **X-axis**:
- Label: "sample" (bottom-right)
- Scale: 0 to 60M (linear increments)
- Position: Bottom of the chart
- **Y-axis**:
- Label: "Learning Rate" (left-aligned)
- Scale: 0 to 5e-5 (logarithmic-like spacing: 1e-5, 2e-5, 3e-5, 4e-5, 5e-5)
- Position: Left side of the chart
- **Legend**:
- Located at the bottom-right corner
- Contains a single entry: maroon line labeled "Learning Rate"
- **Line**:
- Color: Maroon
- Style: Solid
- Data series: Single continuous line
### Detailed Analysis
1. **Initial Phase (0–50M samples)**:
- The learning rate remains constant at approximately **5e-5** for the first 50M samples.
- The line is perfectly horizontal, indicating no change during this interval.
2. **Transition Phase (50M–55M samples)**:
- A gradual decline begins at 50M samples, dropping from 5e-5 to **4.5e-5** by 55M samples.
- The slope is shallow but consistent.
3. **Final Phase (55M–60M samples)**:
- A sharp vertical drop occurs between 55M and 58M samples, reducing the learning rate from 4.5e-5 to **2.8e-5**.
- Another steep decline follows, reaching **0.8e-5** at 60M samples.
### Key Observations
- **Plateau Dominance**: The learning rate remains stable at 5e-5 for 83% of the sample range (0–50M).
- **Abrupt Reduction**: The final 10% of samples (50M–60M) account for 82% of the total learning rate reduction (from 5e-5 to 0.8e-5).
- **Step-like Behavior**: The decline after 50M samples occurs in two distinct phases: a gradual slope followed by a near-vertical drop.
### Interpretation
This chart suggests a learning rate schedule designed for a machine learning training process. The prolonged plateau at 5e-5 implies a stable training phase, while the abrupt reduction after 50M samples indicates a deliberate adjustment to fine-tune the model. The final value of 0.8e-5 at 60M samples may represent an optimized learning rate for convergence. The sharp drop after 55M samples could signal a transition to a more sensitive training stage, requiring smaller learning rate updates to avoid overshooting minima. The absence of intermediate data points between 50M and 60M raises questions about whether this is a programmed schedule or a reactive adjustment.