## Chart: Longer Inferences
### Overview
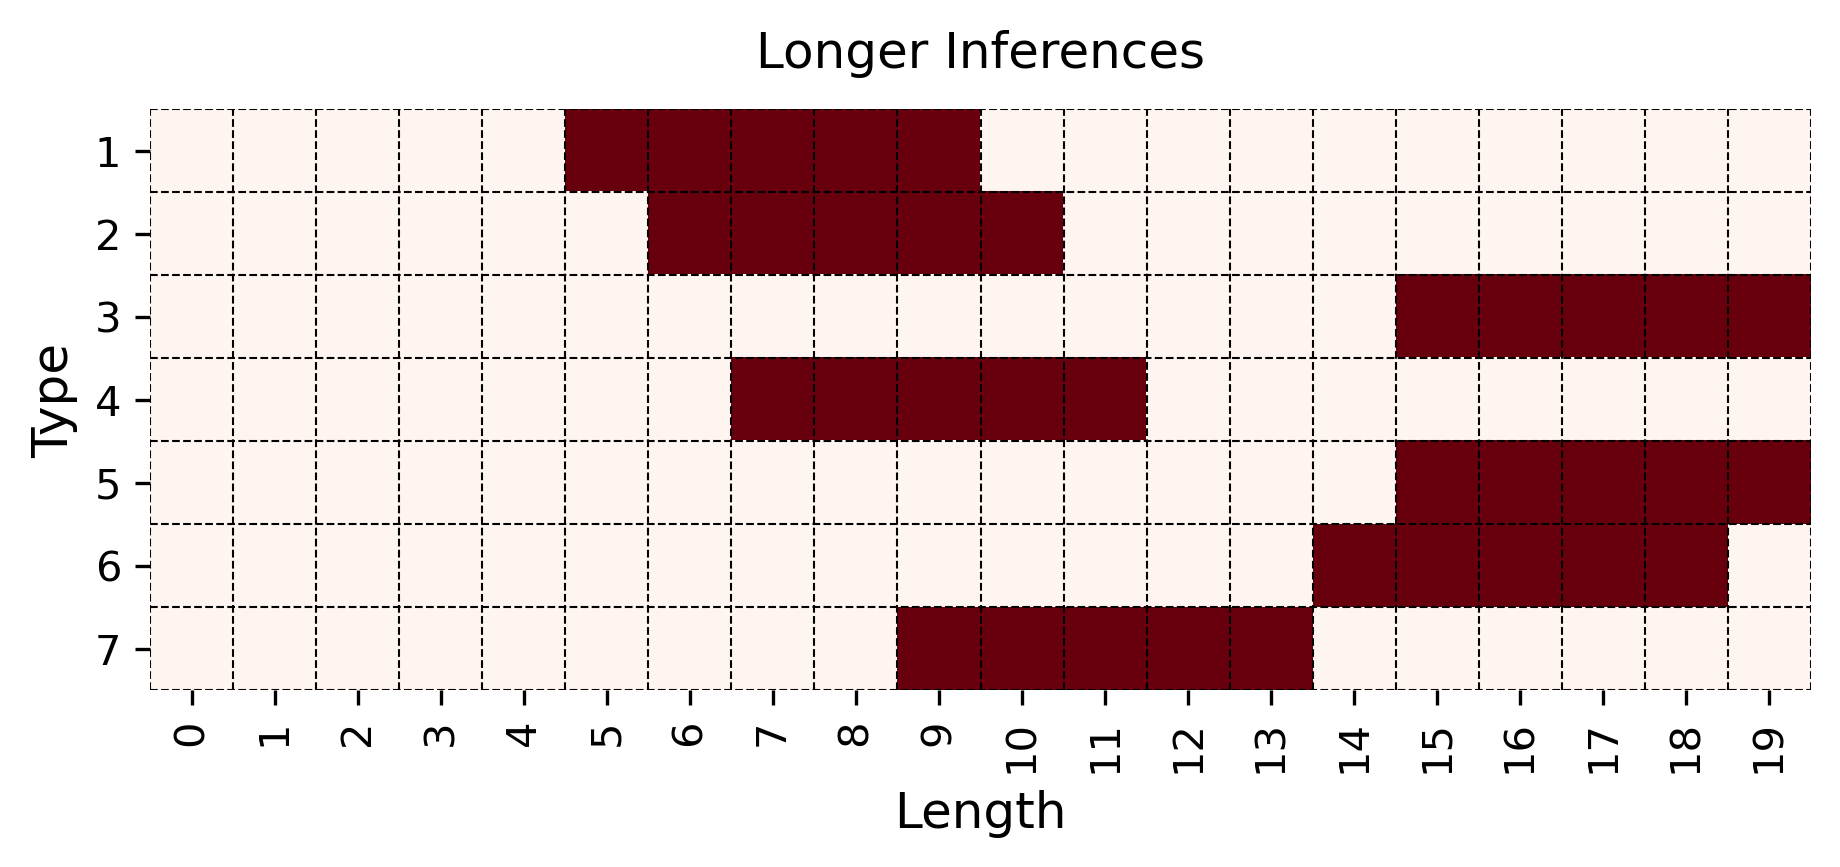
The image is a heatmap visualizing the length of different types of inferences. The x-axis represents the length, ranging from 0 to 19. The y-axis represents the type, ranging from 1 to 7. Dark red cells indicate the presence of an inference of a specific length and type.
### Components/Axes
* **Title:** Longer Inferences
* **X-axis:**
* Label: Length
* Scale: 0, 1, 2, 3, 4, 5, 6, 7, 8, 9, 10, 11, 12, 13, 14, 15, 16, 17, 18, 19
* **Y-axis:**
* Label: Type
* Scale: 1, 2, 3, 4, 5, 6, 7
* **Data:** The heatmap cells are either a light beige color or a dark red color. Dark red indicates the presence of an inference.
### Detailed Analysis
* **Type 1:** Inference spans from length 4 to 11 (inclusive).
* **Type 2:** Inference spans from length 6 to 11 (inclusive).
* **Type 3:** Inference spans from length 15 to 19 (inclusive).
* **Type 4:** Inference spans from length 7 to 11 (inclusive).
* **Type 5:** Inference spans from length 15 to 19 (inclusive).
* **Type 6:** Inference spans from length 14 to 19 (inclusive).
* **Type 7:** Inference spans from length 11 to 13 (inclusive).
### Key Observations
* Types 1, 2, and 4 have inferences of similar lengths, concentrated between lengths 4 and 11.
* Types 3, 5, and 6 have inferences of similar lengths, concentrated between lengths 14 and 19.
* Type 7 has a shorter inference length, concentrated between lengths 11 and 13.
* No inferences are present for lengths 0-3, 12, or 13 for types 1-6.
### Interpretation
The heatmap visualizes the distribution of inference lengths across different types. It suggests that there are two distinct groups of inference types: one with shorter inferences (Types 1, 2, and 4) and another with longer inferences (Types 3, 5, and 6). Type 7 appears to be an outlier with a unique, intermediate inference length. The data could represent different algorithms, models, or data characteristics that lead to varying inference lengths.