\n
## Heatmap: Longer Inferences
### Overview
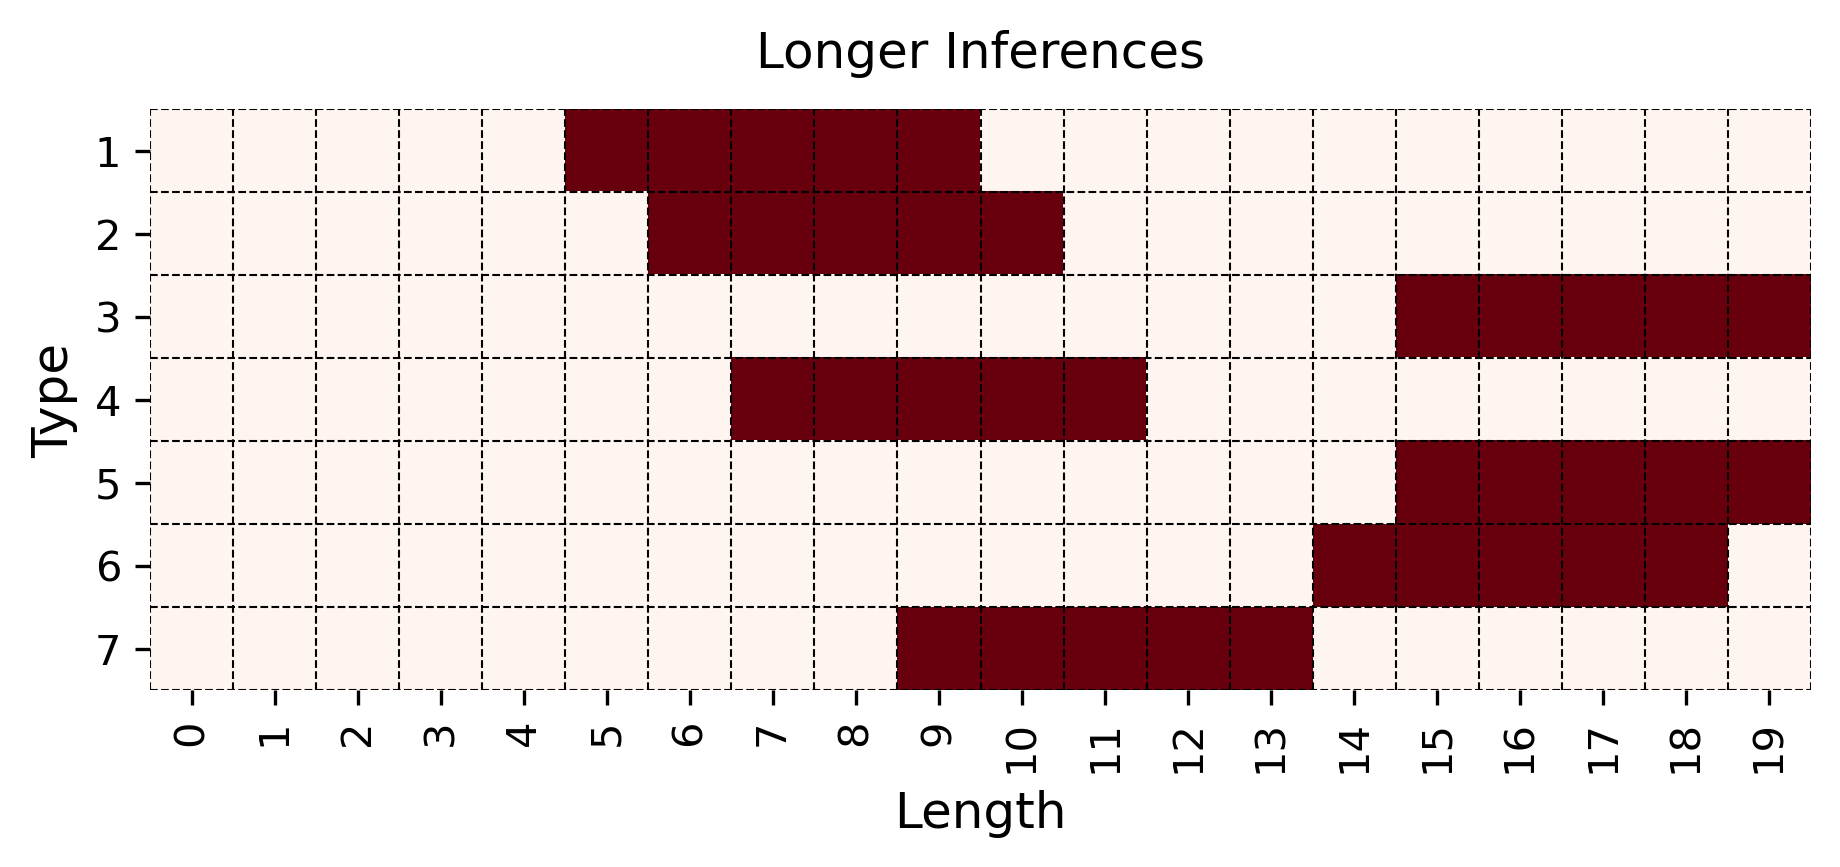
The image presents a heatmap visualizing the distribution of "Longer Inferences" across two dimensions: "Type" and "Length". The heatmap uses a color gradient to represent the density or frequency of occurrences for each combination of Type and Length. The color is a dark red, indicating a consistent level of activity across the board.
### Components/Axes
* **Title:** "Longer Inferences" - positioned at the top-center of the image.
* **X-axis:** "Length" - ranging from 0 to 19, with integer increments.
* **Y-axis:** "Type" - ranging from 1 to 7, with integer increments.
* **Color Scale:** A single dark red color is used throughout the heatmap, suggesting a uniform distribution or a lack of significant variation in density.
### Detailed Analysis
The heatmap displays the following data points (approximated based on visual inspection of the grid):
* **Type 1:** Active from Length 9 to Length 10.
* **Type 2:** Active from Length 5 to Length 6.
* **Type 3:** Active from Length 15 to Length 18.
* **Type 4:** Active from Length 7 to Length 8.
* **Type 5:** Active from Length 15 to Length 19.
* **Type 6:** Active from Length 8 to Length 14.
* **Type 7:** Active from Length 12 to Length 14.
Each cell in the heatmap represents a combination of Type and Length. The dark red color indicates that there is some level of activity for each of these combinations.
### Key Observations
* The heatmap shows a relatively sparse distribution of activity.
* Type 5 has the longest continuous range of activity, spanning from Length 15 to 19.
* Type 2 and Type 4 have the shortest ranges of activity, each spanning only two length units.
* There are no completely empty rows or columns, indicating that each Type and Length value appears at least once.
### Interpretation
The data suggests that "Longer Inferences" are distributed across different "Types" and "Lengths," but not uniformly. The heatmap provides a visual representation of which combinations of Type and Length are more prevalent. The consistent dark red color suggests that the activity level is relatively stable across the board, with no significant outliers or hotspots.
The heatmap could be used to analyze the characteristics of "Longer Inferences" and identify patterns or trends. For example, it could be used to determine which Types tend to have longer inferences or which Lengths are more common for a given Type. The data could also be used to train a model to predict the Type or Length of an inference based on its characteristics.
Without further context, it is difficult to determine the specific meaning of "Type" and "Length" or the significance of the observed patterns. However, the heatmap provides a valuable visual representation of the data and can be used to generate hypotheses and guide further investigation.