# Technical Analysis of "Longer Inferences" Heatmap
## 1. **Axis Labels and Titles**
- **X-Axis (Horizontal):**
- Label: `Length`
- Range: `0` to `19` (integer increments)
- **Y-Axis (Vertical):**
- Label: `Type`
- Range: `1` to `7` (integer increments)
- **Title:**
- `Longer Inferences` (centered at the top of the chart)
## 2. **Legend**
- **Status:** No explicit legend present.
- **Color Interpretation:**
- Dark red squares (`#8B0000`) represent data points.
- Light pink background indicates absence of data.
## 3. **Data Categories and Sub-Categories**
- **X-Axis Categories (`Length`):**
- Discrete integer values from `0` to `19`.
- **Y-Axis Categories (`Type`):**
- Discrete integer values from `1` to `7`.
## 4. **Data Points and Spatial Distribution**
Dark red squares (`#8B0000`) are distributed across the grid as follows:
| **Type** | **Length Ranges with Data** |
|----------|-----------------------------|
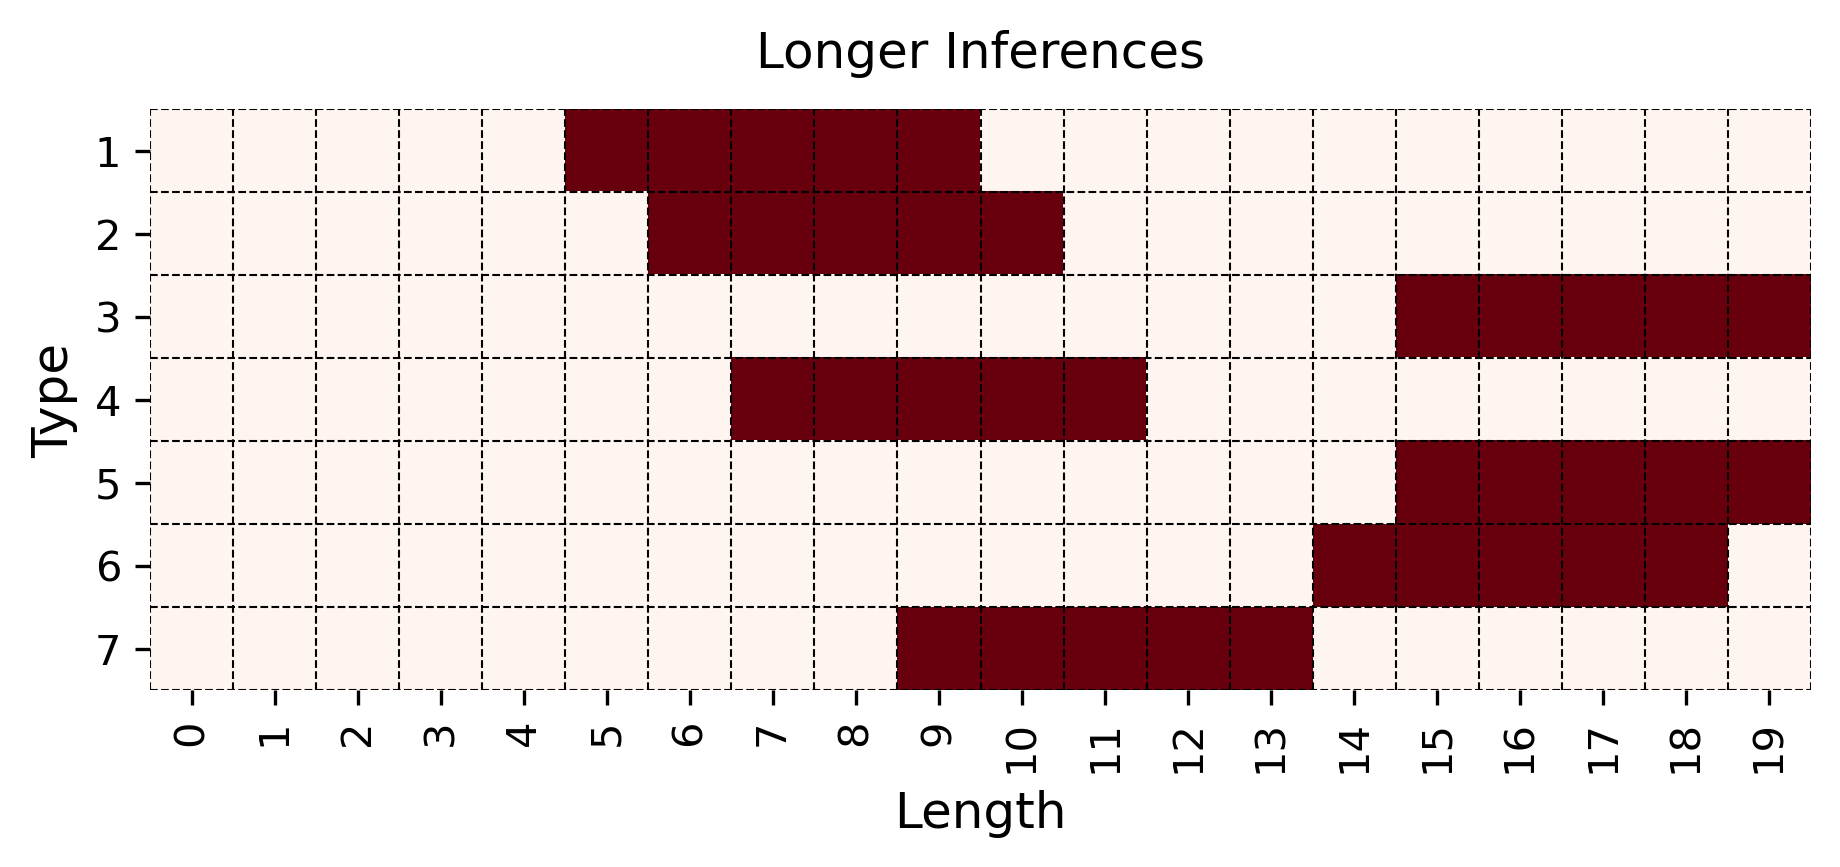
| 1 | 5–8 |
| 2 | 6–10 |
| 3 | 15–18 |
| 4 | 7–11 |
| 5 | 15–17 |
| 6 | 14–18 |
| 7 | 9–13 |
### Spatial Grounding of Data Points
- **Type 1:** Dark red squares occupy cells at `Length` 5–8.
- **Type 2:** Dark red squares span `Length` 6–10.
- **Type 3:** Dark red squares cover `Length` 15–18.
- **Type 4:** Dark red squares range from `Length` 7–11.
- **Type 5:** Dark red squares appear at `Length` 15–17.
- **Type 6:** Dark red squares extend from `Length` 14–18.
- **Type 7:** Dark red squares are present at `Length` 9–13.
## 5. **Trend Verification**
- **Type 1:** Short horizontal bar (5–8), indicating low inference length.
- **Type 2:** Moderate horizontal bar (6–10), slightly longer than Type 1.
- **Type 3:** Long horizontal bar (15–18), highest inference length.
- **Type 4:** Moderate horizontal bar (7–11), overlapping with Type 2.
- **Type 5:** Short horizontal bar (15–17), subset of Type 3’s range.
- **Type 6:** Long horizontal bar (14–18), overlaps with Type 3 and 5.
- **Type 7:** Moderate horizontal bar (9–13), bridges lower and upper ranges.
## 6. **Component Isolation**
- **Header:** Contains the title `Longer Inferences`.
- **Main Chart:** Grid with `Length` (x-axis) and `Type` (y-axis).
- **Footer:** No additional components present.
## 7. **Missing Elements**
- **Legend:** Absent; color interpretation inferred from context.
- **Data Table:** No explicit table; data represented visually via heatmap.
## 8. **Key Observations**
- Types 3, 5, and 6 exhibit the longest inference lengths (14–18).
- Types 1, 2, and 4 show moderate inference lengths (5–11).
- Type 7 bridges moderate and long ranges (9–13).
- No data exists for `Length` 0–4 or `Length` 19.
## 9. **Language and Transcription**
- **Primary Language:** English (all labels, titles, and axis markers).
- **No Secondary Languages Detected.**
## 10. **Conclusion**
The heatmap visualizes the distribution of inference lengths across seven types. Longer inference lengths (14–18) are concentrated in Types 3, 5, and 6, while shorter lengths (5–11) dominate Types 1, 2, and 4. Type 7 acts as an intermediate category.