## SHAP Value Visualization of Digit 7
### Overview
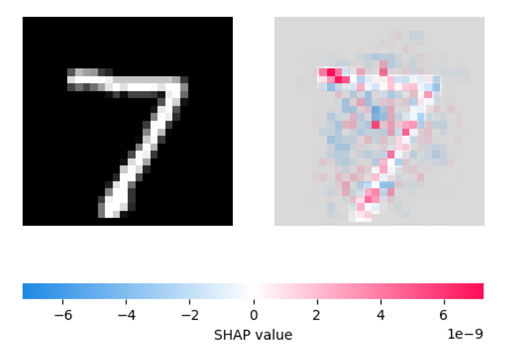
The image presents a visualization of SHAP (SHapley Additive exPlanations) values for a digit recognition model's prediction of the digit "7". It consists of two sub-images: the original image of the digit "7" on the left, and a heatmap of SHAP values overlaid on a gray background on the right. The heatmap uses a blue-to-red color scale to represent negative and positive SHAP values, respectively.
### Components/Axes
* **Left Image:** A 2D image of the digit "7" in white against a black background.
* **Right Image:** A heatmap of SHAP values overlaid on a gray background, roughly in the shape of the digit "7".
* **Color Scale:** A horizontal color scale below the images indicates the range of SHAP values.
* **Left side (Blue):** Represents negative SHAP values, ranging from approximately -6 to 0.
* **Right side (Red):** Represents positive SHAP values, ranging from 0 to approximately 6.
* **X-axis Label:** "SHAP value" is written below the color scale.
* **X-axis Markers:** The color scale is marked with values -6, -4, -2, 0, 2, 4, 6, and 1e-9.
### Detailed Analysis or ### Content Details
* **Digit "7" Image:** The digit "7" is formed by a horizontal stroke at the top and a diagonal stroke extending downwards and to the right.
* **SHAP Value Heatmap:**
* **Red Regions:** Indicate pixels that positively contribute to the model's prediction of "7". These are primarily located along the top horizontal stroke and the upper part of the diagonal stroke.
* **Blue Regions:** Indicate pixels that negatively contribute to the model's prediction of "7". These are scattered around the digit, particularly in the lower part of the diagonal stroke.
* **Gray Background:** Represents pixels with SHAP values close to zero, indicating a neutral contribution to the prediction.
### Key Observations
* The top horizontal stroke and the upper part of the diagonal stroke of the digit "7" have the most positive influence on the model's prediction.
* The lower part of the diagonal stroke has a negative influence, suggesting that these pixels might be more indicative of other digits.
* The SHAP value heatmap provides insights into which pixels are most important for the model's decision-making process.
### Interpretation
The SHAP value visualization highlights the features (pixels) that are most influential in the model's classification of the digit "7". The red regions indicate that the model relies on the presence of these pixels to identify the digit as "7". Conversely, the blue regions suggest that the absence of these pixels, or their presence in a different configuration, would make the model less likely to classify the digit as "7". This type of visualization is useful for understanding and interpreting the behavior of machine learning models, and for identifying potential biases or areas for improvement.