\n
## Heatmap: SHAP Value Explanation for Digit '7'
### Overview
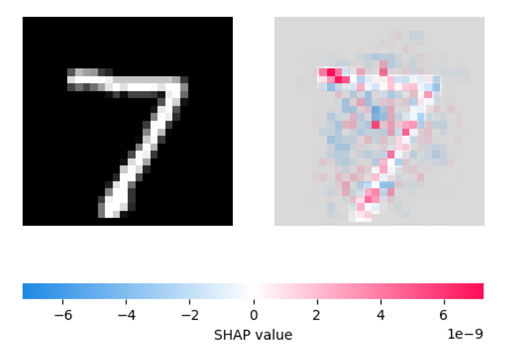
The image presents a visualization of SHAP (SHapley Additive exPlanations) values for a digit '7' image. It consists of the digit '7' itself displayed as a grayscale pixelated image, and a corresponding heatmap showing the contribution of each pixel to the model's prediction. A colorbar at the bottom indicates the SHAP value scale.
### Components/Axes
* **Left Panel:** Grayscale image of the digit '7' on a black background.
* **Right Panel:** Heatmap representing SHAP values for each pixel in the '7' image. The heatmap is a grid of colored squares, with color intensity indicating the magnitude and direction of the SHAP value.
* **Colorbar:** Located at the bottom of the image. It ranges from blue (-6e-9) to red (6e-9), with white representing a value of 0. The label on the colorbar is "SHAP value".
### Detailed Analysis
The heatmap shows a complex pattern of positive (red) and negative (blue) SHAP values. The '7' shape is clearly visible in the heatmap, with the areas corresponding to the stroke of the '7' exhibiting the strongest SHAP values.
* **Positive SHAP Values (Red):** The upper-left and lower-right portions of the '7' stroke show strong positive SHAP values, indicating that these pixels contribute positively to the model's prediction of '7'. The values appear to peak around +4e-9 to +6e-9.
* **Negative SHAP Values (Blue):** The background areas and some parts of the '7' stroke show negative SHAP values, indicating that these pixels contribute negatively to the model's prediction of '7'. The values appear to peak around -4e-9 to -6e-9.
* **Zero SHAP Values (White/Gray):** Areas with SHAP values close to zero have minimal impact on the prediction.
The pixel values are not directly quantifiable from the image, but the color intensity provides a relative measure of their contribution.
### Key Observations
* The heatmap clearly highlights the pixels that are most important for the model's classification of the image as a '7'.
* The areas of the '7' that are most visually salient (the stroke) have the largest SHAP values, both positive and negative.
* The background pixels generally have smaller SHAP values, indicating they are less important for the prediction.
* There is a complex interplay of positive and negative contributions within the '7' shape itself, suggesting that the model is not simply relying on the presence of pixels but also on their specific arrangement.
### Interpretation
This visualization demonstrates how a machine learning model arrives at its prediction for the digit '7'. The SHAP values quantify the contribution of each pixel to the final prediction. The heatmap reveals that the model focuses on the stroke of the '7', with certain pixels within the stroke increasing the confidence in the '7' classification (positive SHAP values) and others potentially decreasing it (negative SHAP values). This could be due to noise or variations in the digit's style.
The color distribution suggests that the model is sensitive to the specific shape and location of the pixels within the '7'. The SHAP values provide insights into the model's decision-making process, allowing us to understand which features (pixels) are most influential in its predictions. This is valuable for debugging the model, identifying potential biases, and improving its robustness. The values are very small (on the order of 1e-9), which is typical for SHAP values and indicates the incremental contribution of each feature.