## Diagram: SRAM-Based Neural Network Layer Architecture
### Overview
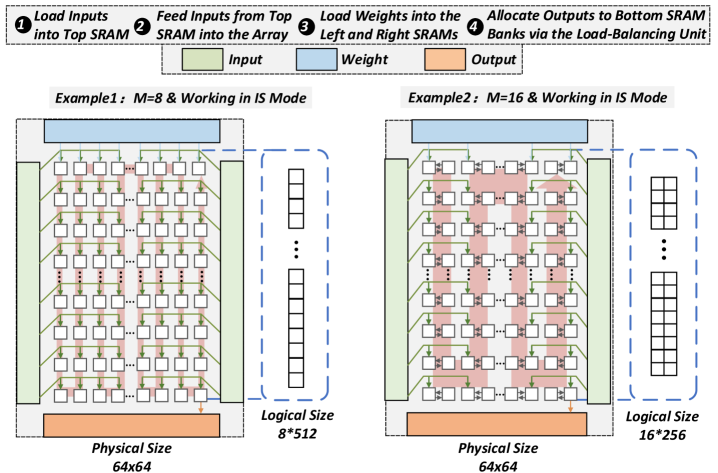
The diagram illustrates a two-stage SRAM-based architecture for processing neural network layers, with two examples (Example1 and Example2) demonstrating different configurations. The system uses three SRAM banks (Top, Left, Right) and a Load-Balancing Unit to manage data flow. Colors represent data types: green (Input), blue (Weight), and orange (Output).
### Components/Axes
- **Legend**:
- Green: Input data
- Blue: Weight data
- Orange: Output data
- **Steps**:
1. Load Inputs into Top SRAM
2. Feed Inputs from Top SRAM into the Array
3. Load Weights into Left and Right SRAMs
4. Allocate Outputs to Bottom SRAM Banks via Load-Balancing Unit
- **Example Labels**:
- Example1: M=8 & Working in IS Mode
- Example2: M=16 & Working in IS Mode
- **Physical Size**: 64x64 (both examples)
- **Logical Sizes**:
- Example1: 8x512
- Example2: 16x256
### Detailed Analysis
- **Example1 (M=8)**:
- Logical size: 8 rows × 512 columns.
- SRAM configuration: Top SRAM feeds into an array of 64x64 processing elements (PEs), with weights distributed across Left/Right SRAMs.
- Outputs are routed to a bottom SRAM bank via the Load-Balancing Unit.
- **Example2 (M=16)**:
- Logical size: 16 rows × 256 columns.
- Similar SRAM structure but with doubled row count and halved column count compared to Example1.
- Increased parallelism in weight loading (visible in denser blue blocks).
### Key Observations
1. **Logical Size Tradeoff**:
- Example1 uses a narrower, deeper logical layout (8x512), while Example2 uses a wider, shallower layout (16x256).
- Both maintain the same physical SRAM size (64x64), suggesting logical partitioning.
2. **Weight Distribution**:
- Weights (blue) are split between Left and Right SRAMs, with Example2 showing more granular allocation.
3. **Load-Balancing Unit**:
- Outputs are dynamically routed to Bottom SRAM banks, implying adaptive resource management.
### Interpretation
- **Architectural Efficiency**:
- Example2’s higher M value (16 vs. 8) suggests improved parallelism for larger batch sizes or more complex operations, while Example1 may prioritize lower latency for smaller workloads.
- **IS Mode**:
- "IS Mode" likely refers to In-Situ processing, where computation occurs directly in SRAM to reduce data movement overhead.
- **Load-Balancing Role**:
- The Load-Balancing Unit ensures outputs are evenly distributed across Bottom SRAM banks, critical for scalability.
- **Uncertainty**:
- Exact SRAM bank capacities and latency metrics are unspecified, limiting quantitative analysis.
### Spatial Grounding
- **Legend**: Top-center, aligned with step labels.
- **Examples**: Side-by-side placement, with Example1 on the left and Example2 on the right.
- **Color Consistency**:
- Green (Input) lines originate from Top SRAM.
- Blue (Weight) lines connect to Left/Right SRAMs.
- Orange (Output) lines terminate at Bottom SRAM.
### Trends/Anomalies
- No numerical trends (non-chart diagram).
- Example2’s denser blue blocks suggest more aggressive weight parallelism.
- Logical size reduction in Example2 (columns halved) may indicate tradeoffs in data locality vs. parallelism.
### Conclusion
The diagram highlights a flexible SRAM-based architecture optimized for neural network inference, balancing parallelism (via M) and data locality (via IS Mode). Example2’s configuration suggests scalability for larger models, while Example1 emphasizes efficiency for smaller workloads. The Load-Balancing Unit is critical for managing output distribution in high-throughput scenarios.