## Bar Chart: Progress Ratio Distribution Across Noise Ratios
### Overview
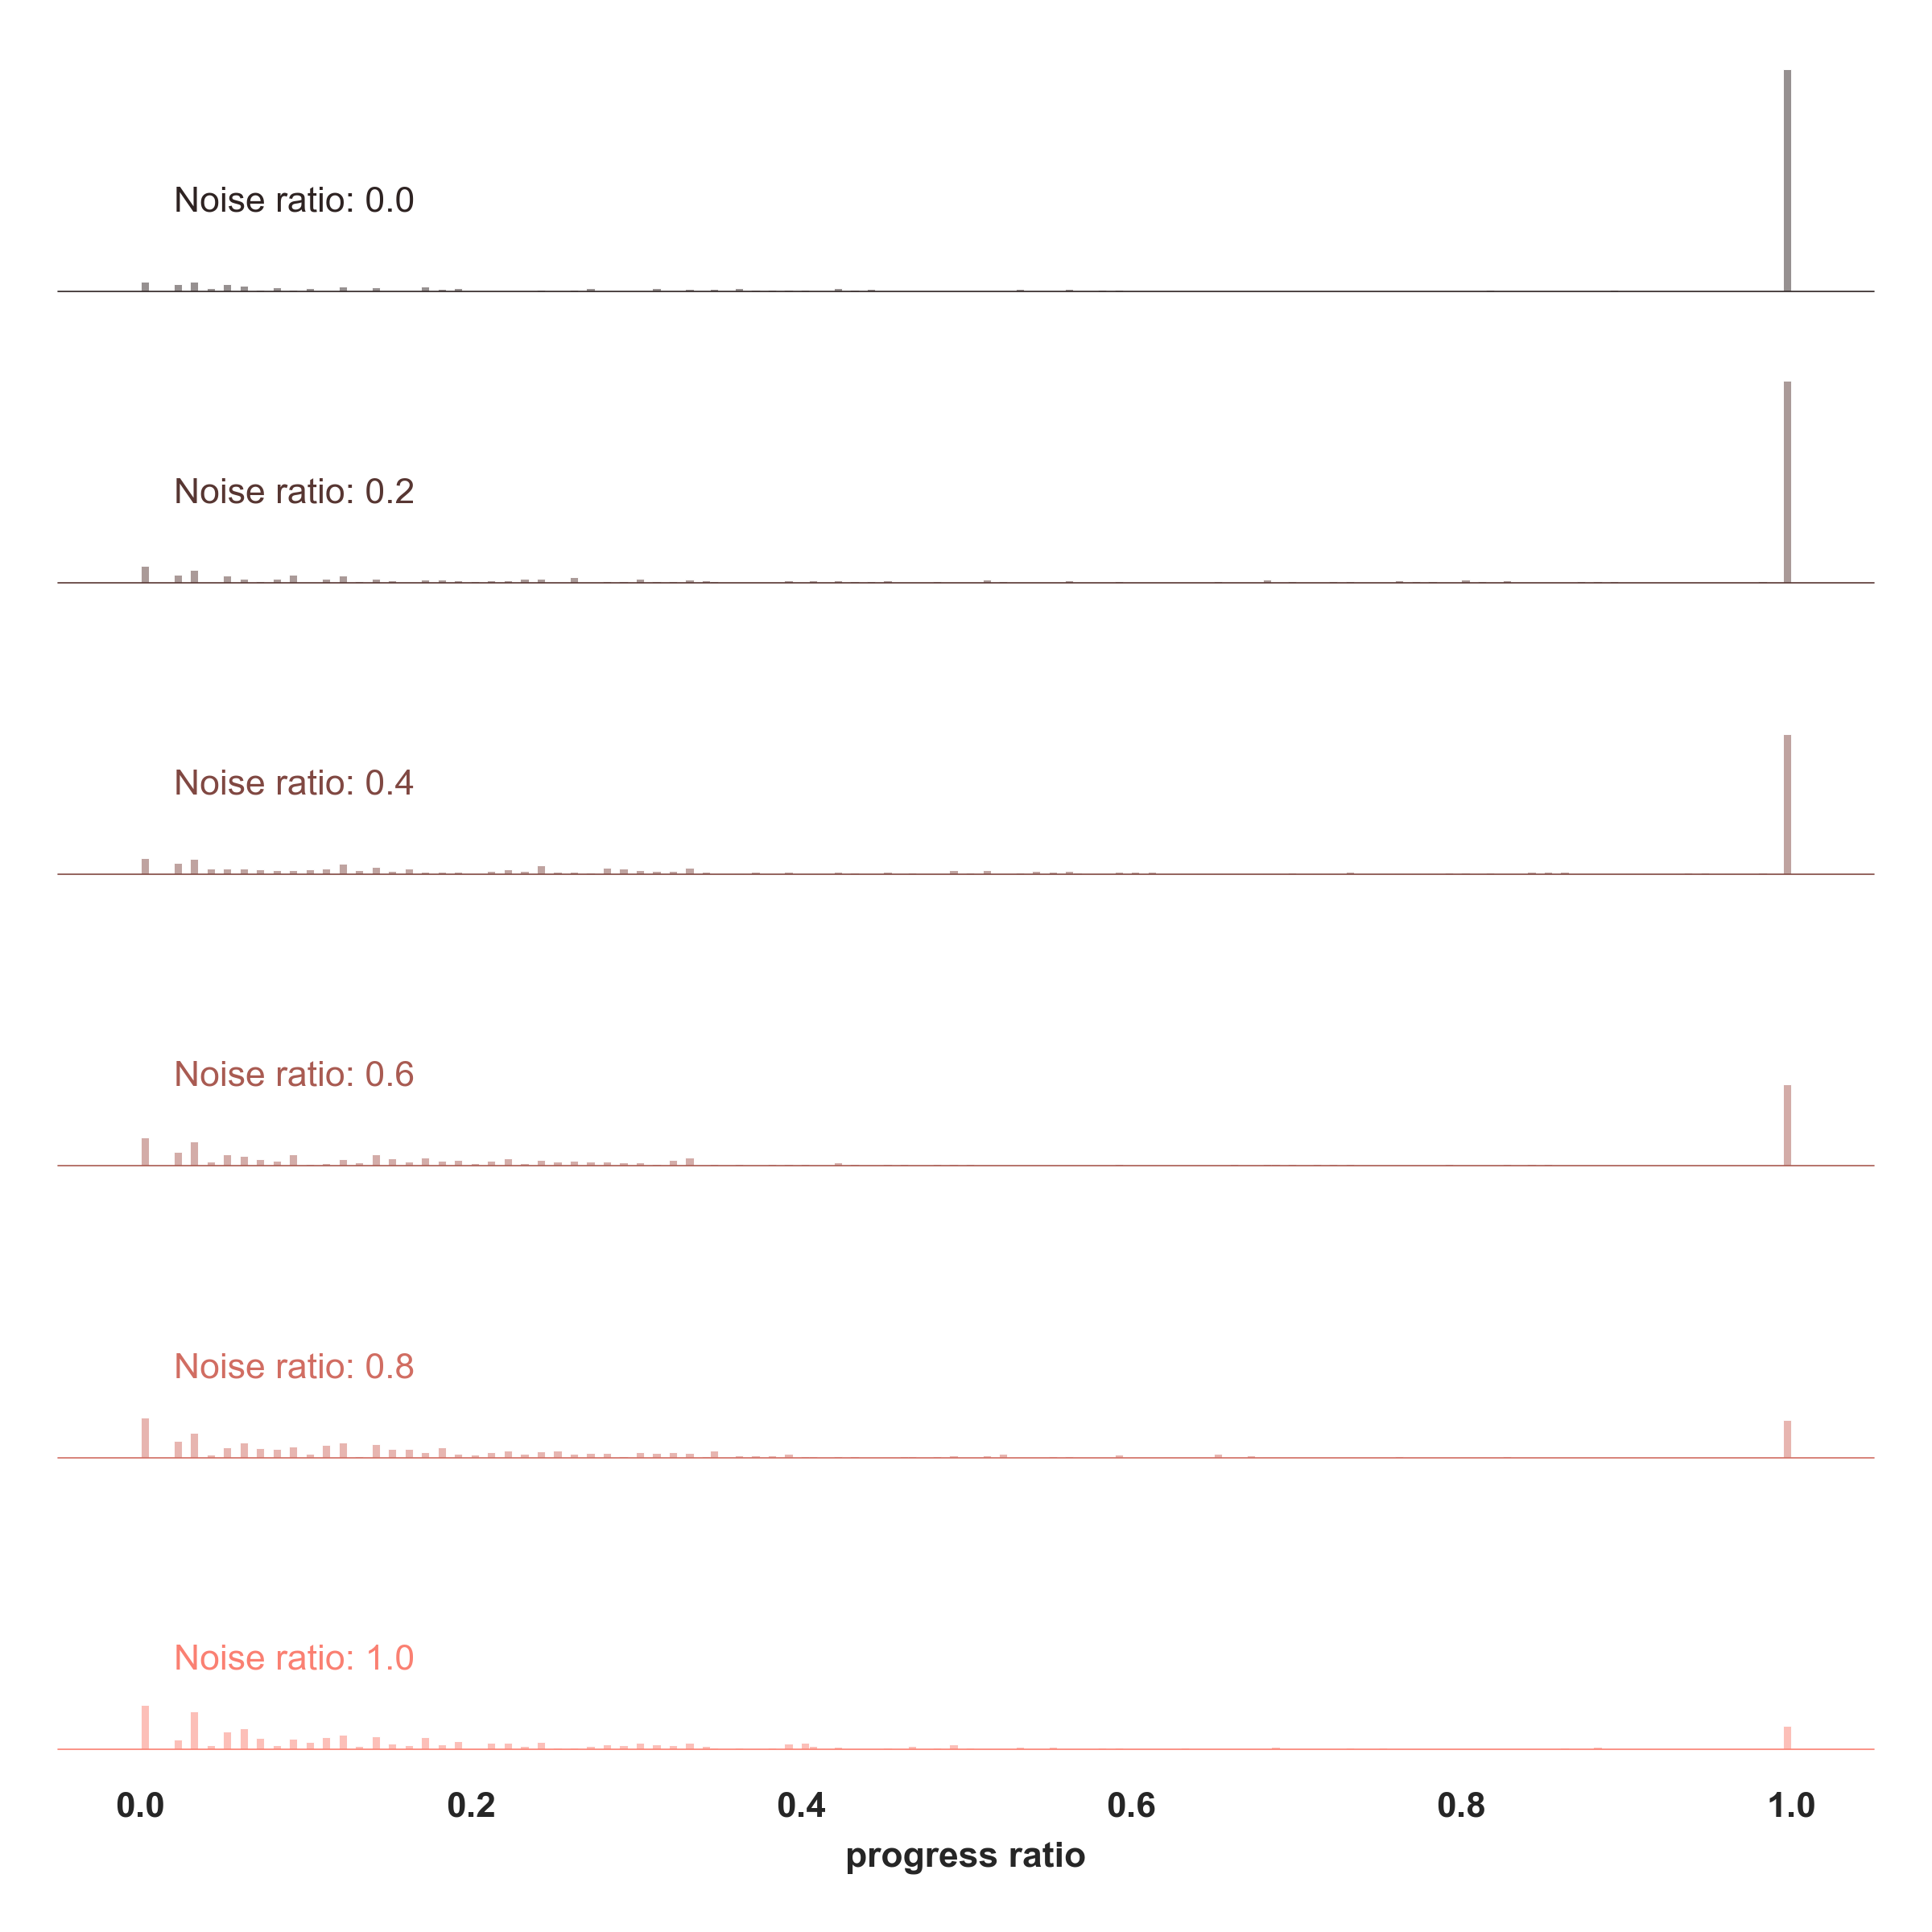
The image displays six horizontal bar charts, each labeled with a distinct noise ratio (0.0 to 1.0). Each chart visualizes the distribution of "progress ratio" values, with the x-axis ranging from 0.0 to 1.0. The bars are predominantly red, and their placement indicates the frequency or probability of specific progress ratios under varying noise conditions.
### Components/Axes
- **X-axis**: Labeled "progress ratio," scaled from 0.0 to 1.0 in increments of 0.2.
- **Y-axis**: Unlabeled, but each chart is vertically stacked, with titles positioned on the left.
- **Legend**: No explicit legend is present, but all bars are red, suggesting a single data series per chart.
- **Titles**: Each chart is labeled with "Noise ratio: [value]" (e.g., "Noise ratio: 0.0," "Noise ratio: 0.2," etc.).
### Detailed Analysis
- **Noise ratio: 0.0**: A single vertical bar at progress ratio 1.0. No other bars are present.
- **Noise ratio: 0.2**: One bar at 1.0 and a few shorter bars at 0.0.
- **Noise ratio: 0.4**: Multiple bars at 0.0 and 0.2, with one bar at 1.0.
- **Noise ratio: 0.6**: Bars spread across 0.0, 0.2, and 0.4, with one bar at 1.0.
- **Noise ratio: 0.8**: Bars distributed between 0.0, 0.2, and 0.4, with one bar at 1.0.
- **Noise ratio: 1.0**: Most bars concentrated at 0.0 and 0.2, with one bar at 1.0.
### Key Observations
1. **Dominance of 1.0**: All charts include at least one bar at progress ratio 1.0, indicating a baseline or maximum value.
2. **Noise-Induced Spread**: As noise ratio increases, the number of bars at lower progress ratios (0.0, 0.2, 0.4) grows, suggesting increased variability.
3. **Progress Ratio Distribution**: Higher noise ratios correlate with a broader spread of progress ratios, implying reduced consistency.
4. **Unlabeled Y-axis**: The absence of a y-axis label limits interpretation of the vertical dimension (e.g., frequency, probability, or count).
### Interpretation
The data suggests that noise ratio directly impacts the distribution of progress ratios. At lower noise levels (0.0–0.2), progress ratios are tightly clustered around 1.0, indicating high consistency. As noise increases (0.4–1.0), the spread of progress ratios widens, reflecting greater variability or instability. This could imply that the system or process being measured is robust to low noise but becomes less reliable under higher noise conditions. The lack of a y-axis label prevents precise quantification of the data (e.g., frequency, probability), but the visual trend clearly demonstrates the relationship between noise and progress ratio distribution.
### Notable Anomalies
- **Consistent 1.0 Bar**: Every chart retains a bar at 1.0, which may represent a fixed or ideal outcome unaffected by noise.
- **Progressive Spread**: The gradual increase in bars at lower progress ratios with higher noise ratios indicates a systematic degradation of performance or accuracy.