## Diagram: Exploration vs. Exploitation in Maze Solving
### Overview
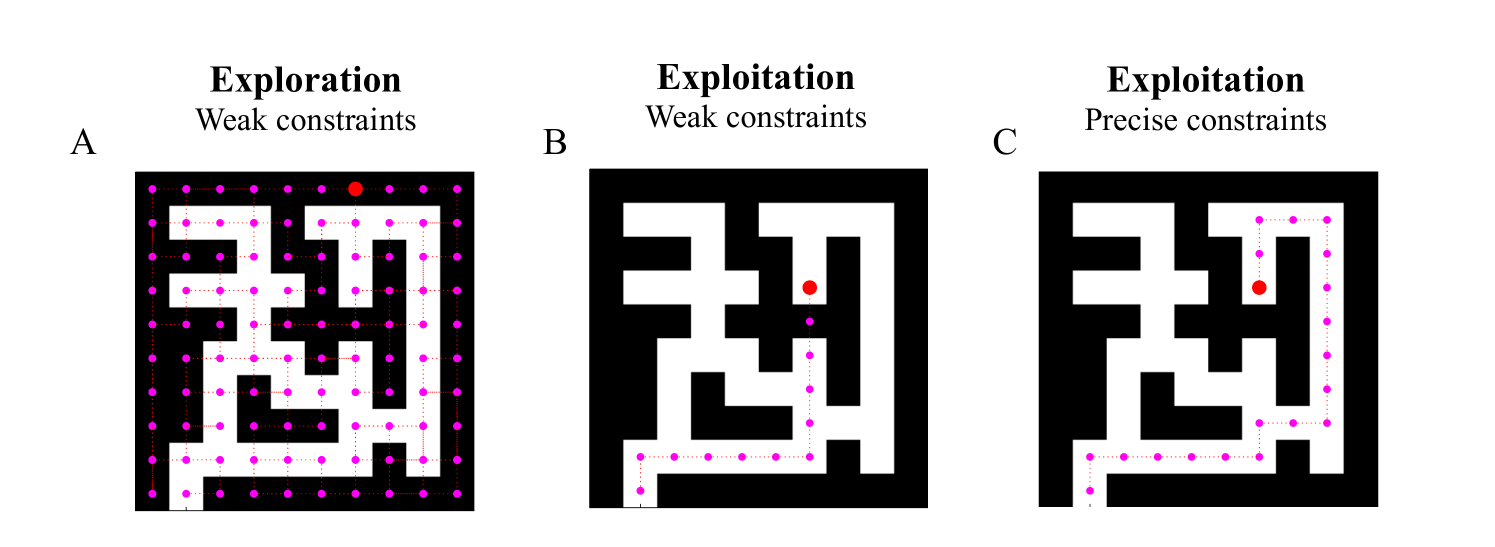
The image presents three diagrams (A, B, and C) illustrating different approaches to solving a maze. Diagram A shows an "Exploration" strategy with "Weak constraints," where the path explores a large portion of the maze. Diagrams B and C show "Exploitation" strategies, with B using "Weak constraints" and C using "Precise constraints." The diagrams depict the maze as a black and white grid, with a starting point marked by a red dot and the path taken represented by a dotted pink line connecting pink dots.
### Components/Axes
* **Diagram A:**
* Title: Exploration, Weak constraints
* Maze: Black and white grid with a complex path.
* Path: Dotted pink line connecting pink dots, starting from the bottom-left and exploring most of the maze.
* Goal: Red dot located near the top-right corner.
* Label: A
* **Diagram B:**
* Title: Exploitation, Weak constraints
* Maze: Black and white grid with a simpler path.
* Path: Dotted pink line connecting pink dots, taking a direct route.
* Goal: Red dot located near the center.
* Label: B
* **Diagram C:**
* Title: Exploitation, Precise constraints
* Maze: Black and white grid with a more direct path.
* Path: Dotted pink line connecting pink dots, taking a more precise route.
* Goal: Red dot located near the center-left.
* Label: C
### Detailed Analysis or Content Details
* **Diagram A (Exploration, Weak constraints):** The path starts at the bottom-left corner and meanders extensively throughout the maze, covering a large area before reaching the red dot at the top-right. The pink dots are distributed relatively evenly across the white spaces of the maze. The path appears to explore many dead ends and alternative routes.
* **Diagram B (Exploitation, Weak constraints):** The path starts at the bottom-left corner and takes a relatively direct route to the red dot located near the center of the maze. The path is shorter and more focused compared to Diagram A.
* **Diagram C (Exploitation, Precise constraints):** The path starts at the bottom-left corner and takes a more direct and precise route to the red dot located near the center-left of the maze. The path is shorter and more focused compared to Diagram A, and more direct than Diagram B.
### Key Observations
* **Exploration vs. Exploitation:** Diagram A demonstrates an exploratory approach, while Diagrams B and C demonstrate exploitative approaches.
* **Constraint Impact:** The "Precise constraints" in Diagram C result in a more direct and efficient path compared to the "Weak constraints" in Diagram B.
* **Path Length:** The path in Diagram A is significantly longer than the paths in Diagrams B and C.
### Interpretation
The diagrams illustrate the trade-off between exploration and exploitation in problem-solving. Exploration (Diagram A) involves a broad search of the solution space, which can be useful when the optimal path is unknown. Exploitation (Diagrams B and C) involves leveraging existing knowledge to take a more direct route to the goal. The "Precise constraints" in Diagram C suggest a more refined understanding of the maze structure, leading to a more efficient solution. The diagrams suggest that as constraints become more precise, the solution path becomes more direct and efficient.