\n
## Diagram: Maze Exploration and Exploitation
### Overview
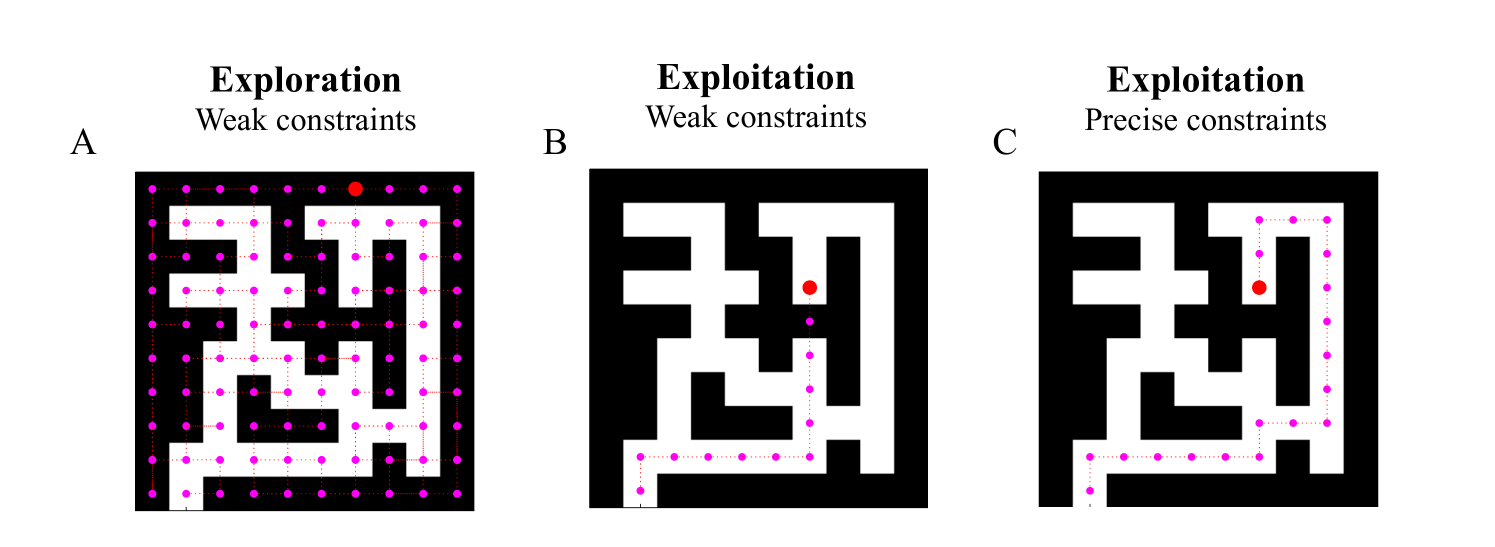
The image presents three diagrams (labeled A, B, and C) depicting maze-like structures. Each diagram illustrates a different stage or approach to navigating a maze: Exploration with weak constraints, Exploitation with weak constraints, and Exploitation with precise constraints. The mazes are represented as black pathways on a white background, with pink dots marking points of interest or visited locations.
### Components/Axes
Each diagram consists of:
* **Maze Structure:** A black, complex pathway forming a maze.
* **Visited Points:** Pink dots scattered within the maze, indicating explored or exploited locations.
* **Labels:** Each diagram is labeled with a stage name (Exploration, Exploitation) and constraint level (Weak, Precise).
* **Diagram Identifiers:** Each diagram is labeled with a letter (A, B, C) in the top-left corner.
### Detailed Analysis or Content Details
**Diagram A: Exploration - Weak Constraints**
* The maze structure is complex, with numerous pathways and dead ends.
* Pink dots are densely scattered throughout the maze, appearing almost randomly distributed. There are approximately 60-70 pink dots visible.
* The dots are not concentrated along any specific path, suggesting a broad, unguided exploration.
**Diagram B: Exploitation - Weak Constraints**
* The maze structure is identical to Diagram A.
* Pink dots are more concentrated along a few primary pathways within the maze. There are approximately 30-40 pink dots visible.
* The dots appear to follow a more defined route, indicating a focus on exploiting certain paths.
**Diagram C: Exploitation - Precise Constraints**
* The maze structure is identical to Diagrams A and B.
* Pink dots are highly concentrated along a single, clear path through the maze. There are approximately 20-30 pink dots visible.
* The dots form a nearly continuous line, demonstrating a precise and focused exploitation of a specific route.
### Key Observations
* The number of visited points (pink dots) decreases as the constraints become more precise, from Exploration (A) to Exploitation (C).
* The distribution of visited points changes from random (A) to focused (B) to highly focused (C), reflecting the increasing level of constraint.
* The maze structure remains constant across all three diagrams, indicating that the difference lies in the navigation strategy rather than the maze itself.
### Interpretation
The diagrams illustrate the transition from a broad exploration phase to a focused exploitation phase in a problem-solving or search context.
* **Exploration (A)** represents a phase where the system or agent is gathering information about the environment without any specific goal or direction. The weak constraints allow for a wide range of possibilities, resulting in a scattered search.
* **Exploitation (B)** represents a phase where the system begins to focus on promising areas identified during exploration. The weak constraints still allow for some flexibility, but the search is no longer entirely random.
* **Exploitation (C)** represents a phase where the system has identified an optimal path and is exploiting it fully. The precise constraints ensure that the search remains focused on this path, maximizing efficiency.
The diagrams suggest that effective problem-solving involves a balance between exploration and exploitation. Initially, a broad exploration is necessary to gather information, but once promising areas are identified, it is important to focus on exploiting them to achieve the desired outcome. The decreasing number of dots with increasing constraints suggests a trade-off between thoroughness and efficiency. The diagrams could represent a robot navigating a maze, an algorithm searching for a solution, or even a human learning a new skill.