## Diagram: Exploration vs. Exploitation Strategies in a Maze Environment
### Overview
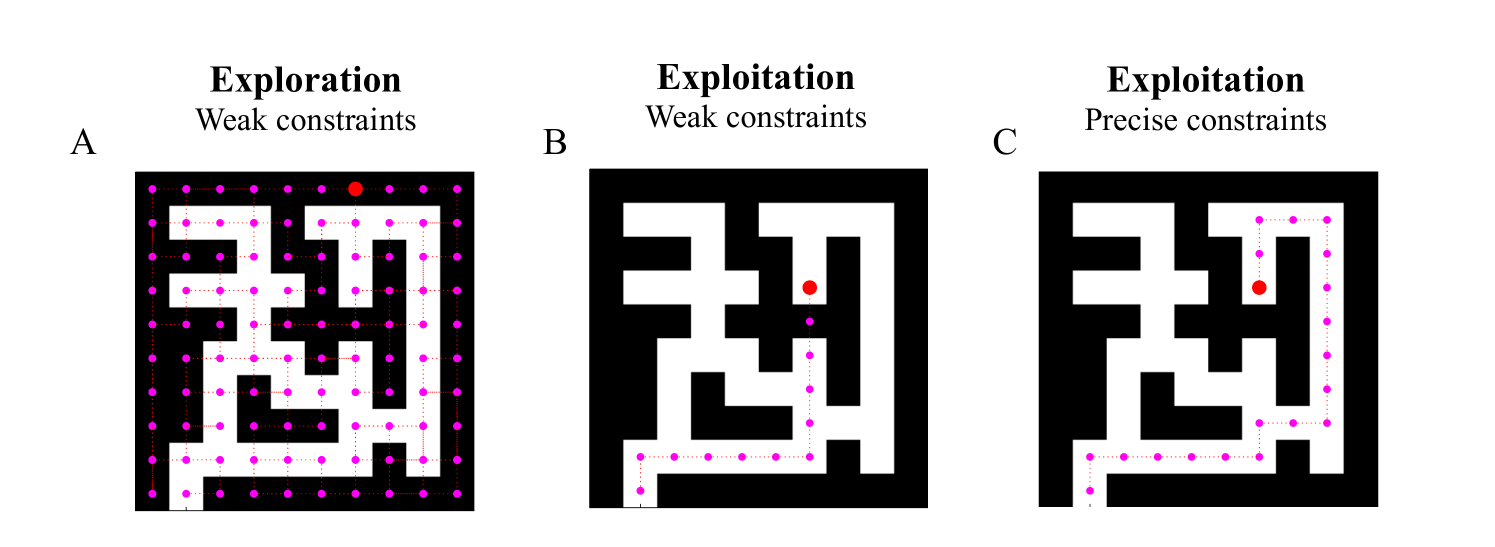
The image displays three side-by-side diagrams (labeled A, B, and C) illustrating different agent strategies within an identical maze environment. Each diagram shows a black square maze with white pathways. A path traced by magenta dots represents the agent's trajectory, and a single red dot marks the agent's current or final position. The diagrams compare "Exploration" and "Exploitation" under different constraint conditions.
### Components/Axes
* **Layout:** Three square maze diagrams arranged horizontally.
* **Labels (Top):**
* **A:** "Exploration" (bold), "Weak constraints" (regular font)
* **B:** "Exploitation" (bold), "Weak constraints" (regular font)
* **C:** "Exploitation" (bold), "Precise constraints" (regular font)
* **Labels (Left):** The letters "A", "B", and "C" are positioned to the left of their respective mazes.
* **Visual Elements:**
* **Maze Structure:** A fixed, complex maze layout with walls (black) and passages (white). The structure is identical in all three diagrams.
* **Path (Magenta Dots):** A series of connected magenta dots traces the route taken by the agent through the white passages.
* **Agent (Red Dot):** A single, larger red dot indicates the agent's location.
* **Legend (Implied):** The color coding is consistent: Magenta = Agent's path/history; Red = Agent's current position.
### Detailed Analysis
**Diagram A: Exploration (Weak constraints)**
* **Path Description:** The magenta path is extensive and dense, covering nearly all accessible white passages in the maze. It forms a complex, branching network that reaches most dead ends and corridors.
* **Agent Position:** The red dot is located in the upper-right quadrant of the maze, at the end of a long, winding path from the bottom-left starting area.
* **Trend:** The visual trend is one of comprehensive coverage, indicating the agent has visited a large proportion of the state space.
**Diagram B: Exploitation (Weak constraints)**
* **Path Description:** The magenta path is significantly shorter and more direct than in A. It follows a specific route from the bottom-left start, moving right, then up, then right again into a central corridor. It does not explore side passages.
* **Agent Position:** The red dot is located in the central-right area of the maze, at the terminus of this direct path.
* **Trend:** The visual trend is goal-directed and efficient, focusing on a single, seemingly optimal route without deviation.
**Diagram C: Exploitation (Precise constraints)**
* **Path Description:** The magenta path is very similar to Diagram B, following the same general efficient route. However, there is a subtle but critical difference: the path makes a small, precise detour or loop in the upper-right section before returning to the main corridor. This suggests adherence to a more specific or refined rule set.
* **Agent Position:** The red dot is located in the same central-right corridor as in B, but its position relative to the path's end is slightly different due to the detour.
* **Trend:** The trend is still efficient and goal-directed, but with an added layer of precision or adherence to a stricter policy, resulting in a minor variation in the path.
### Key Observations
1. **Path Density Gradient:** There is a clear visual gradient in path density from A (very high) to B and C (low). This directly illustrates the core trade-off: exploration consumes more resources (time, steps) to gather information, while exploitation uses gathered information to act efficiently.
2. **Identical Environment, Different Behavior:** The maze structure is constant, proving that the differences in agent behavior are due solely to the chosen strategy (Exploration vs. Exploitation) and the nature of the constraints (Weak vs. Precise).
3. **Constraint Impact:** Comparing B and C shows that "Precise constraints" lead to a more nuanced path than "Weak constraints," even under the same high-level strategy of exploitation. The precise constraints likely enforce a more specific policy, preventing the minor inefficiencies or variations seen in the weak constraint version.
4. **Spatial Grounding:** In all diagrams, the agent starts in the bottom-left corner. The exploration path (A) fills the space from this origin. The exploitation paths (B, C) show a clear, linear progression from origin to a goal region in the center-right.
### Interpretation
This diagram is a pedagogical visualization of fundamental concepts in reinforcement learning and decision theory.
* **Exploration vs. Exploitation:** Diagram A represents an agent prioritizing **exploration**—gathering maximum information about the environment's structure, even at the cost of immediate efficiency. This is crucial in unknown environments to build an accurate model. Diagrams B and C represent **exploitation**—using existing knowledge to maximize reward or reach a goal quickly. The trade-off is clear: exploration builds a better long-term model but is slow; exploitation is fast but risks being suboptimal if the model is incomplete.
* **Role of Constraints:** "Weak constraints" (A & B) likely refer to a loose policy or objective function, allowing for more randomness or broader goals (e.g., "visit many states" or "reach the general goal area"). "Precise constraints" (C) imply a stricter, more defined policy (e.g., "follow this exact sequence of actions" or "adhere to this specific safety rule"), which refines the agent's behavior even within an exploitation framework.
* **Underlying Message:** The image argues that the optimal strategy is context-dependent. In a completely unknown maze, starting with behavior like A is necessary. Once a good map is built (knowledge from A), switching to behavior like B or C is efficient. The difference between B and C highlights how the specificity of the learned policy or external rules fine-tunes exploitative behavior. The diagrams effectively translate abstract algorithmic concepts into an intuitive spatial narrative.