## Diagram: Exploration vs. Exploitation Scenarios with Varying Constraints
### Overview
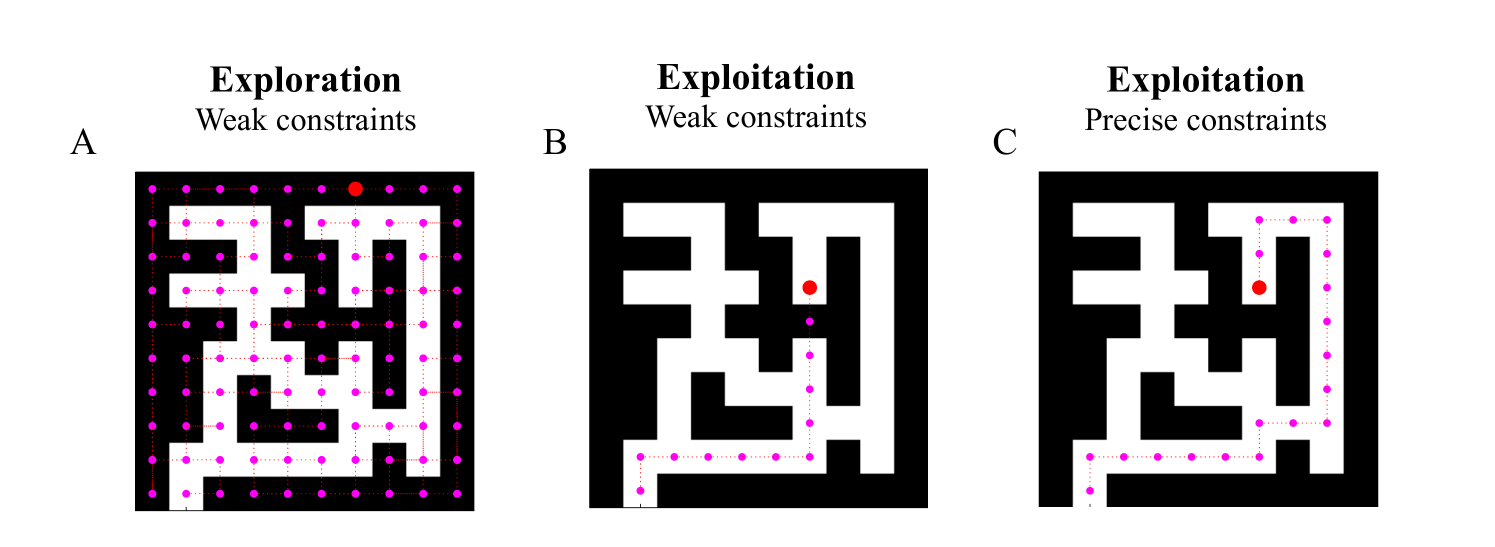
The image presents three panels (A, B, C) depicting maze-like structures with pink dots (connected by dotted lines) and a single red dot. Each panel is labeled with a title indicating a scenario involving "Exploration" or "Exploitation" under specific constraint conditions. The visual progression suggests a comparison of exploration/exploitation behavior under weak vs. precise constraints.
### Components/Axes
- **Panels**:
- **Panel A**: "Exploration Weak constraints"
- Maze-like grid with dense pink dots (≈50–60) connected by dotted lines.
- Red dot located near the top-center.
- **Panel B**: "Exploitation Weak constraints"
- Simplified maze with fewer pink dots (≈20–30) and a linear path.
- Red dot positioned near the bottom-left.
- **Panel C**: "Exploitation Precise constraints"
- Highly constrained maze with minimal pink dots (≈5–10) and a rigid path.
- Red dot located near the top-right.
- **Visual Elements**:
- **Pink Dots**: Represent nodes or waypoints.
- **Dotted Lines**: Indicate potential paths or connections.
- **Red Dot**: Likely a target or goal position.
- **Black Walls**: Define boundaries of the maze.
### Detailed Analysis
- **Panel A**:
- High density of pink dots suggests extensive exploration.
- Dotted lines form a complex network, implying many possible paths.
- Red dot’s central position may indicate a focal point for exploration.
- **Panel B**:
- Reduced number of pink dots and linear paths suggest a shift toward exploitation.
- Red dot’s placement near the bottom-left implies a prioritized target.
- **Panel C**:
- Minimal pink dots and rigid paths indicate strict constraints limiting exploration.
- Red dot’s top-right position may reflect a constrained optimization goal.
### Key Observations
1. **Constraint Impact**:
- Weak constraints (A, B) allow more exploration (A) or focused exploitation (B).
- Precise constraints (C) drastically reduce exploration, favoring rigid exploitation.
2. **Red Dot Positioning**:
- Panel A: Central placement may reflect exploratory targeting.
- Panels B and C: Red dots shift toward corners, suggesting constrained goal-seeking.
3. **Path Complexity**:
- Panel A: Highly interconnected paths.
- Panels B and C: Linear or fragmented paths, indicating reduced flexibility.
### Interpretation
The diagram illustrates a trade-off between exploration and exploitation under varying constraints:
- **Weak Constraints**:
- **Exploration (A)**: Maximizes path diversity, favoring discovery.
- **Exploitation (B)**: Balances exploration with targeted goal-seeking.
- **Precise Constraints (C)**: Enforces strict exploitation, minimizing exploration to prioritize efficiency.
The red dot’s movement from central (A) to corner positions (B, C) visually encodes how constraints narrow decision-making. This aligns with optimization principles where weak constraints enable broader search spaces, while precise constraints enforce deterministic outcomes.
**Note**: No numerical data or explicit legend is present; analysis is based on visual patterns and positional logic.