## Diagram: Geometric Shape Configurations
### Overview
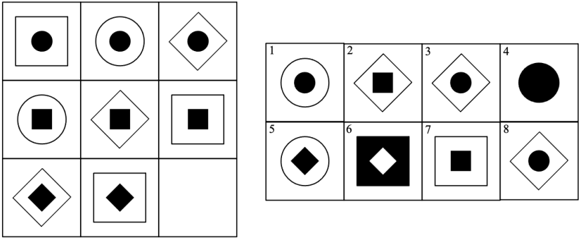
The image displays two grids of geometric shapes with numerical labels. The left grid is a 3x3 matrix (9 cells), while the right grid is a 2x4 matrix (8 cells). Each cell contains a distinct geometric configuration (e.g., circles, squares, diamonds) with variations in fill color, outline style, and internal patterns. The grids are unlabeled beyond their numerical indices.
### Components/Axes
- **Left Grid (3x3)**:
- **Rows/Columns**: No explicit axis titles.
- **Labels**: Cells numbered 1–9 (bottom-right cell empty).
- **Shapes**: Squares, circles, diamonds.
- **Fill/Outline**: Black/white fill, solid/outline borders.
- **Right Grid (2x4)**:
- **Rows/Columns**: No explicit axis titles.
- **Labels**: Cells numbered 1–8.
- **Shapes**: Circles, squares, diamonds.
- **Fill/Outline**: Black/white fill, solid/outline borders.
### Detailed Analysis
- **Left Grid**:
- **Cell 1**: Black circle with white outline.
- **Cell 2**: White circle with black outline.
- **Cell 3**: Black diamond with white outline.
- **Cell 4**: White circle with black outline.
- **Cell 5**: Black square with white outline.
- **Cell 6**: White square with black outline.
- **Cell 7**: Black diamond with white outline.
- **Cell 8**: White diamond with black outline.
- **Cell 9**: Empty.
- **Right Grid**:
- **Cell 1**: Black circle with white outline.
- **Cell 2**: Black square with white outline.
- **Cell 3**: Black diamond with white outline.
- **Cell 4**: Solid black circle.
- **Cell 5**: Black circle with white diamond outline.
- **Cell 6**: Solid black square with white diamond outline.
- **Cell 7**: Solid black square with white square outline.
- **Cell 8**: Black circle with white outline.
### Key Observations
1. **Symmetry and Repetition**:
- Cells 1, 4, and 8 in the right grid share identical configurations (black circle with white outline).
- Cells 2, 5, and 8 in the left grid repeat the white circle with black outline.
2. **Color Logic**:
- Black shapes dominate the right grid, while the left grid alternates black/white fills.
- White outlines are more frequent in the left grid.
3. **Missing Data**:
- The bottom-right cell (9) in the left grid is empty, suggesting an incomplete sequence or placeholder.
### Interpretation
This diagram likely represents a classification system or step-by-step process for geometric configurations. The numbered cells may correspond to stages, categories, or options in a decision tree. The repetition of shapes (e.g., circles in cells 1, 4, 8) could indicate recurring elements or default states. The empty cell (9) might signify an unresolved step or a variable that depends on prior choices. The use of fill/outline contrasts suggests differentiation between primary and secondary attributes (e.g., "solid" vs. "outlined" states).
**Note**: No numerical data, trends, or textual legends are present. The image relies on visual patterns and positional logic for interpretation.