## Line Chart: Local Learning Coefficient vs. Iteration for Different Batch Sizes
### Overview
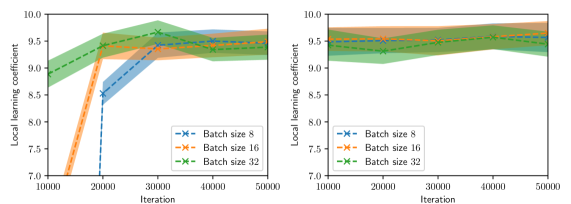
The image contains two line charts comparing the local learning coefficient against the iteration number for different batch sizes (8, 16, and 32). The charts show the performance of each batch size over a range of iterations, with shaded regions indicating variability. The left chart shows the initial learning phase, while the right chart shows a more stable, later phase.
### Components/Axes
* **Y-axis (Local learning coefficient):** Ranges from 7.0 to 10.0 in both charts, with tick marks at 7.0, 7.5, 8.0, 8.5, 9.0, 9.5, and 10.0.
* **X-axis (Iteration):** Ranges from 10000 to 50000 in both charts, with tick marks at 10000, 20000, 30000, 40000, and 50000.
* **Legend (bottom-left of the left chart, bottom-left of the right chart):**
* Blue line with 'x' markers: Batch size 8
* Orange line with 'x' markers: Batch size 16
* Green line with 'x' markers: Batch size 32
### Detailed Analysis
**Left Chart:**
* **Batch size 8 (Blue):** The line starts at approximately 7.0 at 10000 iterations and rises sharply to approximately 8.5 at 20000 iterations. It then continues to rise, reaching approximately 9.3 at 30000 iterations, and stabilizes around 9.5 at 40000 and 50000 iterations.
* **Batch size 16 (Orange):** The line starts at approximately 7.0 at 10000 iterations and rises sharply to approximately 9.3 at 20000 iterations. It then stabilizes around 9.4 at 30000, 40000 and 50000 iterations.
* **Batch size 32 (Green):** The line starts at approximately 8.8 at 10000 iterations and rises to approximately 9.6 at 30000 iterations. It then stabilizes around 9.5 at 40000 and 50000 iterations.
**Right Chart:**
* **Batch size 8 (Blue):** The line starts at approximately 9.3 at 10000 iterations and remains relatively stable around 9.5 at 20000, 30000, 40000 and 50000 iterations.
* **Batch size 16 (Orange):** The line starts at approximately 9.5 at 10000 iterations and remains relatively stable around 9.6 at 20000, 30000, 40000 and 50000 iterations.
* **Batch size 32 (Green):** The line starts at approximately 9.3 at 10000 iterations and remains relatively stable around 9.5 at 20000, 30000, 40000 and 50000 iterations.
### Key Observations
* In the left chart, batch sizes 8 and 16 show a significant initial increase in the local learning coefficient, while batch size 32 starts with a higher initial value.
* In the right chart, all batch sizes have stabilized, showing similar performance with minor fluctuations.
* The shaded regions around each line indicate the variability or uncertainty in the local learning coefficient for each batch size.
### Interpretation
The charts suggest that different batch sizes have varying initial learning curves. Batch sizes 8 and 16 require more iterations to reach a stable local learning coefficient compared to batch size 32. However, after a certain number of iterations (as shown in the right chart), all batch sizes converge to a similar performance level. The shaded regions indicate the robustness of each batch size, with narrower regions suggesting more consistent performance. The choice of batch size may depend on the trade-off between initial learning speed and overall stability.