\n
## Line Chart: Local Learning Coefficient vs. Iteration for Different Batch Sizes
### Overview
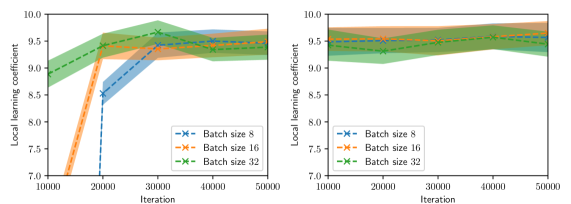
The image presents two line charts displaying the relationship between the local learning coefficient and the iteration number for three different batch sizes (8, 16, and 32). Both charts share the same axes and legend, but appear to represent different experimental conditions or runs. The charts visualize how the local learning coefficient evolves over iterations for each batch size, with shaded areas representing the standard deviation or confidence interval around the mean.
### Components/Axes
* **X-axis:** Iteration, ranging from approximately 10,000 to 50,000.
* **Y-axis:** Local learning coefficient, ranging from approximately 7.0 to 10.0.
* **Legend:** Located in the bottom-center of the image.
* Batch size 8 (Blue dashed line with 'x' markers)
* Batch size 16 (Orange dashed line with '+' markers)
* Batch size 32 (Green dashed line with '*' markers)
* **Chart 1 (Left):** Shows a more dynamic change in the local learning coefficient over iterations.
* **Chart 2 (Right):** Shows a more stable local learning coefficient over iterations.
### Detailed Analysis or Content Details
**Chart 1 (Left):**
* **Batch Size 8 (Blue):** Starts at approximately 9.2 at iteration 10,000. Decreases sharply to approximately 7.2 at iteration 20,000. Then increases steadily to approximately 9.4 at iteration 50,000.
* **Batch Size 16 (Orange):** Starts at approximately 8.8 at iteration 10,000. Increases to approximately 9.4 at iteration 20,000. Then decreases to approximately 9.1 at iteration 30,000, and stabilizes around 9.2 at iteration 50,000.
* **Batch Size 32 (Green):** Starts at approximately 9.0 at iteration 10,000. Increases steadily to approximately 9.6 at iteration 30,000. Then decreases slightly to approximately 9.5 at iteration 50,000.
**Chart 2 (Right):**
* **Batch Size 8 (Blue):** Remains relatively stable around 9.5 from iteration 10,000 to 50,000, with minor fluctuations.
* **Batch Size 16 (Orange):** Starts at approximately 9.5 at iteration 10,000. Decreases slightly to approximately 9.3 at iteration 20,000, then stabilizes around 9.4 at iteration 50,000.
* **Batch Size 32 (Green):** Starts at approximately 9.6 at iteration 10,000. Decreases slightly to approximately 9.5 at iteration 50,000.
### Key Observations
* **Chart 1:** Batch size 8 exhibits the most significant fluctuation in the local learning coefficient, while batch size 32 shows the most stable behavior. Batch size 16 shows an intermediate behavior.
* **Chart 2:** All batch sizes demonstrate relatively stable local learning coefficients throughout the iterations.
* The shaded areas around the lines indicate the variability in the local learning coefficient for each batch size. The width of the shaded area suggests the degree of uncertainty or variance.
### Interpretation
The charts likely represent the training process of a machine learning model, where the local learning coefficient is adjusted during optimization. The batch size influences the stability and speed of convergence.
* **Chart 1** suggests that a smaller batch size (8) can lead to more volatile learning dynamics, potentially due to higher gradient variance. The initial drop in the learning coefficient for batch size 8 could indicate an initial period of instability or adaptation. Larger batch sizes (16 and 32) appear to provide more stable learning, but may converge slower.
* **Chart 2** indicates that under different conditions (or after some initial adaptation), all batch sizes achieve a stable local learning coefficient. This suggests that the model has converged to a stable state, regardless of the batch size.
The difference between the two charts could be due to different initialization conditions, learning rate schedules, or other hyperparameters. The charts demonstrate the importance of batch size selection in training machine learning models, as it can significantly impact the learning dynamics and convergence behavior. The consistent trend across both charts is that larger batch sizes tend to result in more stable learning, while smaller batch sizes can be more sensitive to noise and fluctuations.