## Line Chart: Local Learning Coefficient vs. Iteration (Two Panels)
### Overview
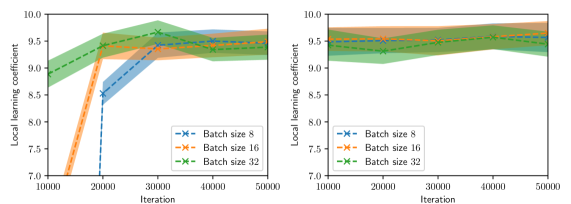
The image contains two side-by-side line charts comparing the evolution of a "Local learning coefficient" across 50,000 iterations for three batch sizes (8, 16, 32). Each panel uses shaded confidence intervals (light-colored bands) to represent uncertainty. The left panel shows dynamic trends with significant fluctuations, while the right panel demonstrates stabilized behavior.
---
### Components/Axes
- **X-axis (Iteration)**:
- Range: 10,000 to 50,000
- Labels: "10000", "20000", "30000", "40000", "50000"
- **Y-axis (Local learning coefficient)**:
- Range: 7.0 to 10.0
- Labels: "7.0", "7.5", "8.0", "8.5", "9.0", "9.5", "10.0"
- **Legends**:
- **Left Panel**:
- Blue line with "x" markers: Batch size 8
- Orange line with "x" markers: Batch size 16
- Green line with "x" markers: Batch size 32
- **Right Panel**:
- Same color/marker scheme as left panel
- **Shading**: Light-colored bands around lines indicate 95% confidence intervals.
---
### Detailed Analysis
#### Left Panel (Dynamic Trends)
1. **Batch size 8 (Blue)**:
- Starts at ~8.5 (10k iterations)
- Sharp spike to ~9.5 at 20k iterations
- Drops to ~9.0 by 30k iterations
- Stabilizes near ~9.2 by 50k iterations
2. **Batch size 16 (Orange)**:
- Begins at ~9.0 (10k iterations)
- Dips to ~8.5 at 20k iterations
- Rises to ~9.3 by 30k iterations
- Fluctuates between ~9.1–9.4 by 50k iterations
3. **Batch size 32 (Green)**:
- Starts at ~9.5 (10k iterations)
- Dips to ~9.2 at 20k iterations
- Rises to ~9.4 by 30k iterations
- Stabilizes near ~9.3 by 50k iterations
#### Right Panel (Stabilized Behavior)
1. **All batch sizes**:
- Begin near 9.5 (10k iterations)
- Minor fluctuations between 9.3–9.6 across all iterations
- Confidence intervals narrow significantly compared to left panel
- Lines converge toward ~9.4–9.5 by 50k iterations
---
### Key Observations
1. **Left Panel**:
- Batch size 8 exhibits the highest volatility, with a 1.0-point swing between 10k–20k iterations.
- Batch size 32 maintains the highest baseline values but shows moderate dips.
- Confidence intervals are widest for batch size 8, indicating greater uncertainty.
2. **Right Panel**:
- All batch sizes converge to similar values (~9.4–9.5) after 30k iterations.
- Confidence intervals are 2–3x narrower than the left panel, suggesting stabilized learning.
- No significant divergence between batch sizes after 30k iterations.
---
### Interpretation
The left panel likely represents an early training phase where smaller batch sizes (8) introduce higher variability in learning dynamics, possibly due to noisy gradient estimates. The right panel demonstrates convergence toward stable learning coefficients as iterations increase, with larger batch sizes (32) showing marginally better stability. The narrowing confidence intervals in the right panel suggest that the model’s uncertainty decreases with prolonged training, and batch size has diminishing returns on learning coefficient stability after ~30k iterations. This implies that while batch size affects early-stage learning dynamics, long-term convergence is less sensitive to batch size choices.