## Line Chart: Similarity Distributions to MSCOCO
### Overview
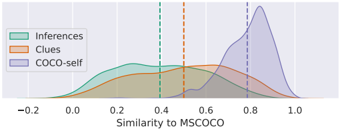
The chart compares the similarity distributions of three methods ("Inferences," "Clues," and "COCO-self") to the MSCOCO dataset. The x-axis represents similarity scores (ranging from -0.2 to 1.0), and the y-axis represents density. Three density curves are plotted, with vertical dashed lines marking key similarity thresholds at 0.4, 0.5, and 0.8.
### Components/Axes
- **X-axis**: "Similarity to MSCOCO" (scale: -0.2 to 1.0, markers at -0.2, 0.0, 0.2, 0.4, 0.6, 0.8, 1.0).
- **Y-axis**: "Density" (no explicit scale, but curves suggest normalized distributions).
- **Legend**: Located in the top-left corner, with colors:
- Green: Inferences
- Orange: Clues
- Purple: COCO-self
- **Dashed Lines**: Vertical lines at x = 0.4 (green), 0.5 (orange), and 0.8 (purple).
### Detailed Analysis
1. **Inferences (Green)**:
- Starts near 0 at x = -0.2, rises to a peak at ~0.4, then declines.
- Density drops sharply after 0.4, approaching zero by x = 0.8.
- Overlaps with "Clues" between x = 0.2 and 0.6.
2. **Clues (Orange)**:
- Begins at x = 0, peaks at ~0.5, then declines.
- Density remains non-zero up to x = 0.8, with a gradual slope.
- Overlaps with "Inferences" in the 0.2–0.6 range.
3. **COCO-self (Purple)**:
- Starts at x = 0.4, rises sharply to a peak at ~0.8, then declines.
- Density is zero for x < 0.4 and x > 0.9.
- Highest peak (taller than other curves) at x = 0.8.
### Key Observations
- **Peak Differences**:
- "COCO-self" peaks at 0.8, significantly higher than "Inferences" (0.4) and "Clues" (0.5).
- "Inferences" and "Clues" share overlapping density regions between 0.2 and 0.6.
- **Thresholds**:
- Dashed lines at 0.4, 0.5, and 0.8 align with the peaks of each method, suggesting these are critical similarity benchmarks.
- **Data Gaps**:
- No data below x = -0.2 for any method.
- "COCO-self" has no density below 0.4 or above 0.9.
### Interpretation
The chart demonstrates that "COCO-self" achieves the highest similarity to MSCOCO, with a sharp peak at 0.8, indicating superior alignment or performance compared to "Inferences" and "Clues." The vertical dashed lines likely represent predefined thresholds for evaluating similarity, with "COCO-self" exceeding all others. The overlap between "Inferences" and "Clues" suggests these methods perform similarly in the mid-range similarity domain (0.2–0.6). The absence of data below -0.2 implies these values are either irrelevant or not measured. The sharp decline of "Inferences" after 0.4 highlights a potential limitation in its ability to generalize beyond moderate similarity scores.