## Density Plot: Similarity to MSCOCO
### Overview
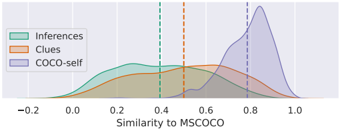
The image is a density plot comparing the similarity of three different datasets ("Inferences", "Clues", and "COCO-self") to the MSCOCO dataset. The x-axis represents the similarity score, ranging from -0.2 to 1.0. The y-axis represents the density of data points at each similarity score. Vertical dashed lines indicate the approximate mean similarity for each dataset.
### Components/Axes
* **X-axis:** "Similarity to MSCOCO", ranging from -0.2 to 1.0 in increments of 0.2.
* **Y-axis:** Density (no explicit scale provided).
* **Legend (Top-Left):**
* "Inferences" (Sea Green)
* "Clues" (Orange)
* "COCO-self" (Lavender)
* **Vertical Dashed Lines:**
* Sea Green: Represents the mean similarity for "Inferences". Located at approximately 0.4.
* Orange: Represents the mean similarity for "Clues". Located at approximately 0.5.
* Lavender: Represents the mean similarity for "COCO-self". Located at approximately 0.8.
### Detailed Analysis
* **Inferences (Sea Green):** The density plot for "Inferences" starts around -0.2 and peaks around 0.3, then gradually decreases. The mean similarity is indicated by a sea green dashed line at approximately 0.4.
* **Clues (Orange):** The density plot for "Clues" starts around -0.1 and peaks around 0.5, then decreases. The mean similarity is indicated by an orange dashed line at approximately 0.5.
* **COCO-self (Lavender):** The density plot for "COCO-self" starts around 0.4 and peaks around 0.8, then decreases sharply. The mean similarity is indicated by a lavender dashed line at approximately 0.8.
### Key Observations
* "COCO-self" has the highest mean similarity to MSCOCO, followed by "Clues", and then "Inferences".
* The "COCO-self" distribution is more concentrated around its mean, while "Inferences" and "Clues" have wider distributions.
* The "Inferences" distribution has a longer tail towards lower similarity scores.
### Interpretation
The density plot illustrates how similar the "Inferences", "Clues", and "COCO-self" datasets are to the MSCOCO dataset. The "COCO-self" dataset, as expected, exhibits the highest similarity, suggesting it is most closely aligned with the MSCOCO data. "Clues" shows a moderate similarity, while "Inferences" has the lowest similarity and a broader range, indicating greater variability in its relationship to MSCOCO. The mean similarity lines provide a quick visual comparison of the central tendency for each dataset's similarity to MSCOCO.