## Density Plot: Similarity to MSCOCO
### Overview
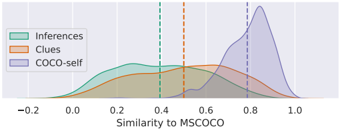
This image displays a Kernel Density Estimation (KDE) plot comparing the distribution of three distinct datasets—"Inferences," "Clues," and "COCO-self"—based on their "Similarity to MSCOCO." The plot uses shaded areas to represent the probability density of each dataset and vertical dashed lines to indicate the central tendency (likely the mean or median) for each group.
### Components/Axes
* **X-Axis:** Labeled "Similarity to MSCOCO." The scale ranges from -0.2 to 1.0, with major tick marks at intervals of 0.2.
* **Y-Axis:** Represents probability density (unlabeled, but implied by the shaded area height).
* **Legend:** Positioned in the top-left area of the chart.
* **Inferences:** Represented by a teal/light-green color.
* **Clues:** Represented by an orange color.
* **COCO-self:** Represented by a light purple color.
* **Vertical Markers:** Three dashed lines correspond to the colors in the legend:
* **Teal dashed line:** Positioned at approximately 0.4 on the x-axis.
* **Orange dashed line:** Positioned at approximately 0.5 on the x-axis.
* **Purple dashed line:** Positioned at approximately 0.8 on the x-axis.
### Detailed Analysis
#### 1. Inferences (Teal)
* **Visual Trend:** The distribution begins rising near -0.1, forms a broad, relatively flat-topped peak between 0.2 and 0.4, and then gradually declines, with a long tail extending toward 0.8.
* **Central Tendency:** The teal dashed line marks the center at approximately 0.4.
#### 2. Clues (Orange)
* **Visual Trend:** The distribution starts rising near 0.0, shows a broader, slightly right-skewed peak centered around 0.5 to 0.6, and maintains a significant density extending toward 0.9.
* **Central Tendency:** The orange dashed line marks the center at approximately 0.5.
#### 3. COCO-self (Purple)
* **Visual Trend:** This distribution is distinct from the others. It remains near zero until approximately 0.4, then rises sharply to a prominent, narrow peak around 0.85, before dropping off rapidly toward 1.0.
* **Central Tendency:** The purple dashed line marks the center at approximately 0.8.
### Key Observations
* **High Similarity of COCO-self:** The "COCO-self" distribution is shifted significantly to the right compared to "Inferences" and "Clues," indicating a much higher degree of similarity to the MSCOCO dataset.
* **Overlap:** There is substantial overlap between the "Inferences" and "Clues" distributions, suggesting that these two categories share similar characteristics regarding their similarity to MSCOCO.
* **Distribution Shape:** "COCO-self" exhibits a much tighter, more concentrated distribution (lower variance) compared to the broader, flatter distributions of "Inferences" and "Clues."
### Interpretation
The data suggests that "COCO-self" is likely a baseline or ground-truth dataset derived directly from or highly correlated with the MSCOCO dataset, explaining its high similarity score (peaking near 0.85).
Conversely, "Inferences" and "Clues" appear to be generated outputs or secondary datasets that are less aligned with the original MSCOCO distribution. The fact that "Clues" has a slightly higher central tendency (0.5) than "Inferences" (0.4) suggests that the "Clues" generation process may capture slightly more features of the MSCOCO dataset than the "Inferences" process, though both remain significantly less similar to the reference than "COCO-self." The vertical lines serve as clear markers for the average performance or similarity of each respective method.